Cryosphere-Atmosphere Dynamics
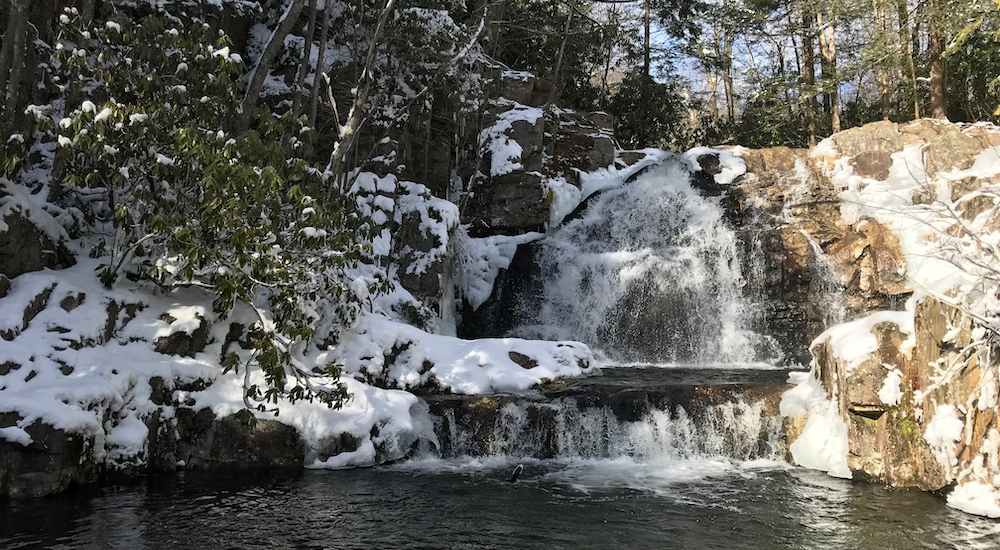
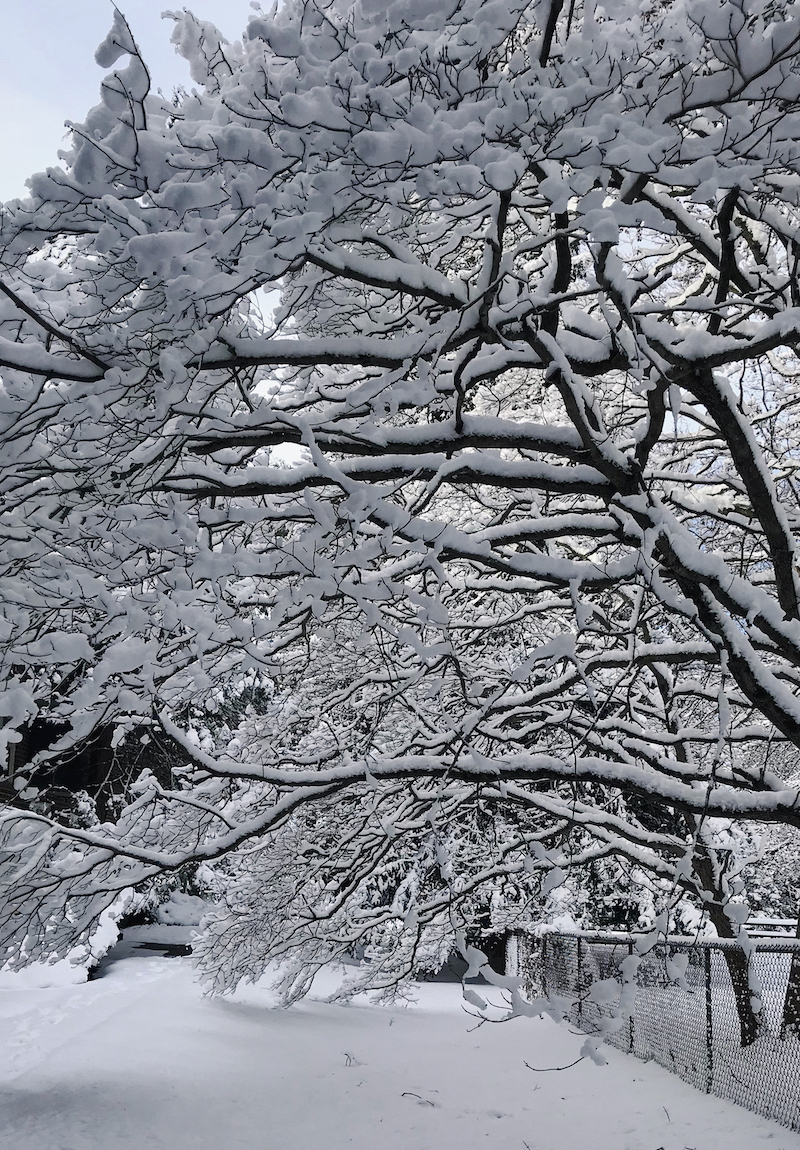
The surface cover of the earth is a dynamic and integral part of the radiation balance; as such, changes from one surface cover type to another have implications for energy fluxes across the planet. The spectral differences between a cryo-covered (ice or snow) and a bare (exposed ground or open ocean) surface are extreme with the cryo-covered surface typically having a much higher albedo than the bare surface. This shift in albedo from one surface type to the other and resulting impacts on the radiation balance have been the subject of much research, although many additional implications are still unknown.
The Earth's cryo-cover (defined here as snow cover and sea ice) is dynamic and varies considerably on both interannual and seasonal time-scales. Consensus agrees that snow cover and sea ice areas are changing, but there is still much work to be done on where, how much, and what influence these changes will have.
The lab has analyzed snow cover and sea ice both as a comprehensive cryo-cover spatially and temporally but also as distinct cover types. Distinction between the type of cryo-cover present (whether it is a stable/ consistent cover or a transient/ephemeral cover) has also been studied, as coverage consistency complicates radiative processes and dynamics.
Cryo-cover spatiotemporal variations, and transitions, are a crucial component of the global climate system. Many of the teleconnections between a rapidly changing cryosphere and larger atmospheric dynamics are still being discovered.
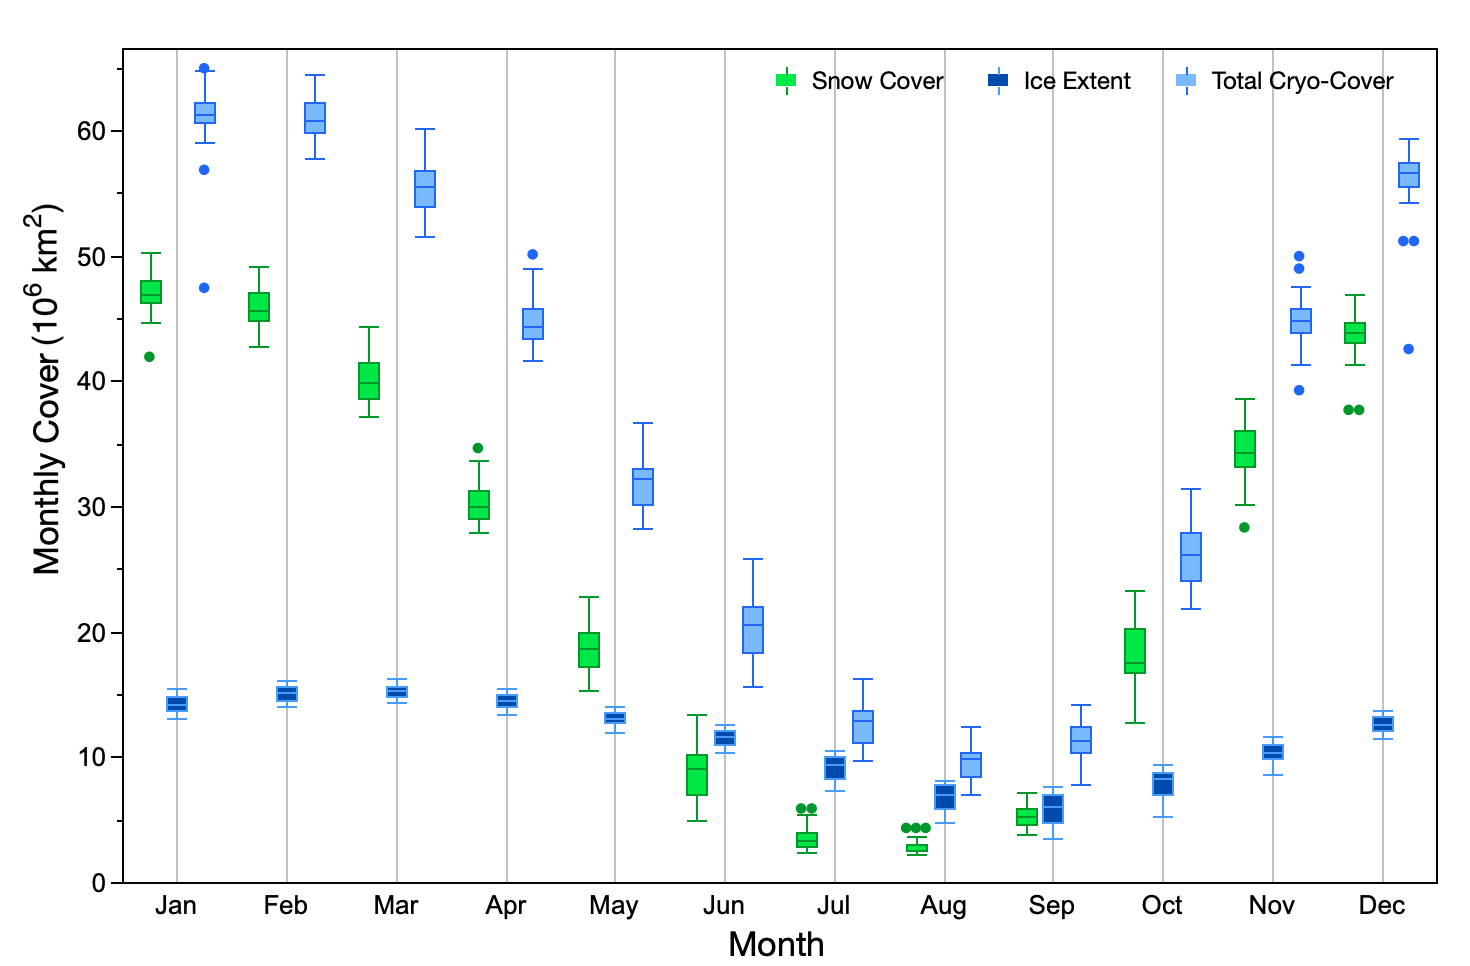
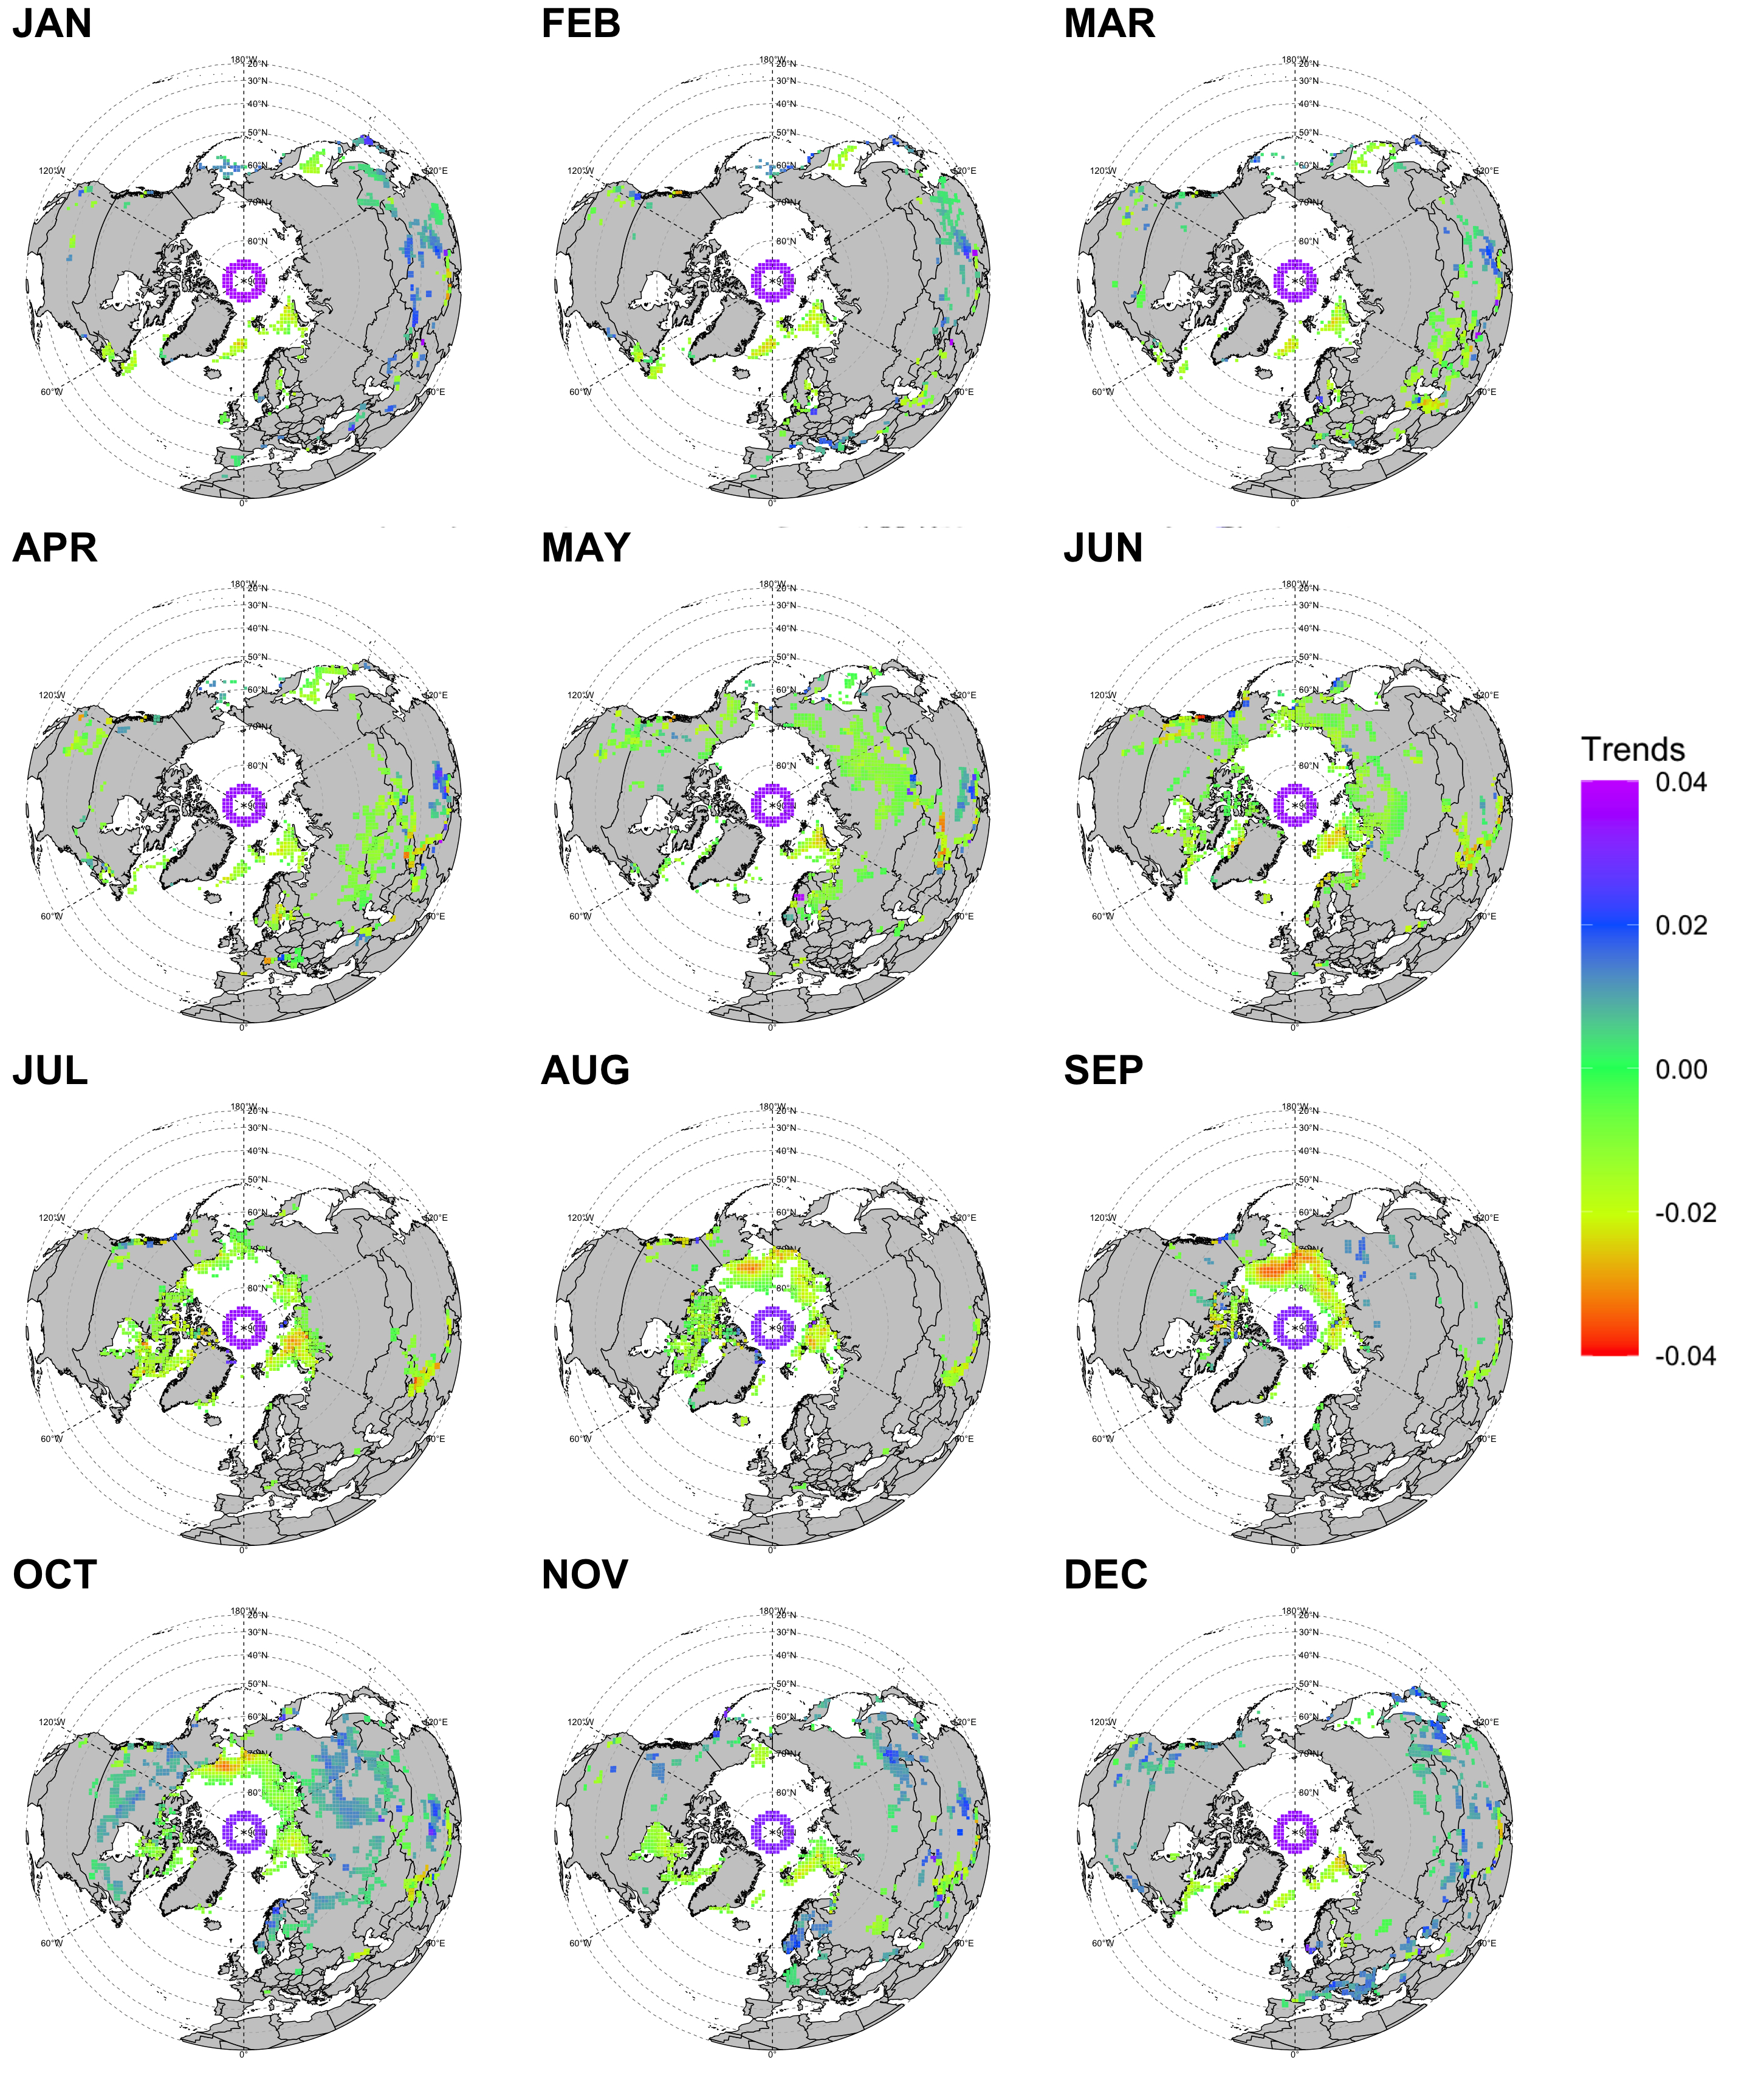
To build a foundation in Northern Hemisphere cryo-cover dynamics, three datasets were used (covering 1979-2020): National Snow and Ice Data Center (NSIDC) Sea Ice Extent, Rutgers Global Snow Lab (GSL) Snow Cover Extent and MeaSuREs State of the Cryosphere values (a binary coverage dataset including both snow and ice where the temporal coverage ended in 2012).
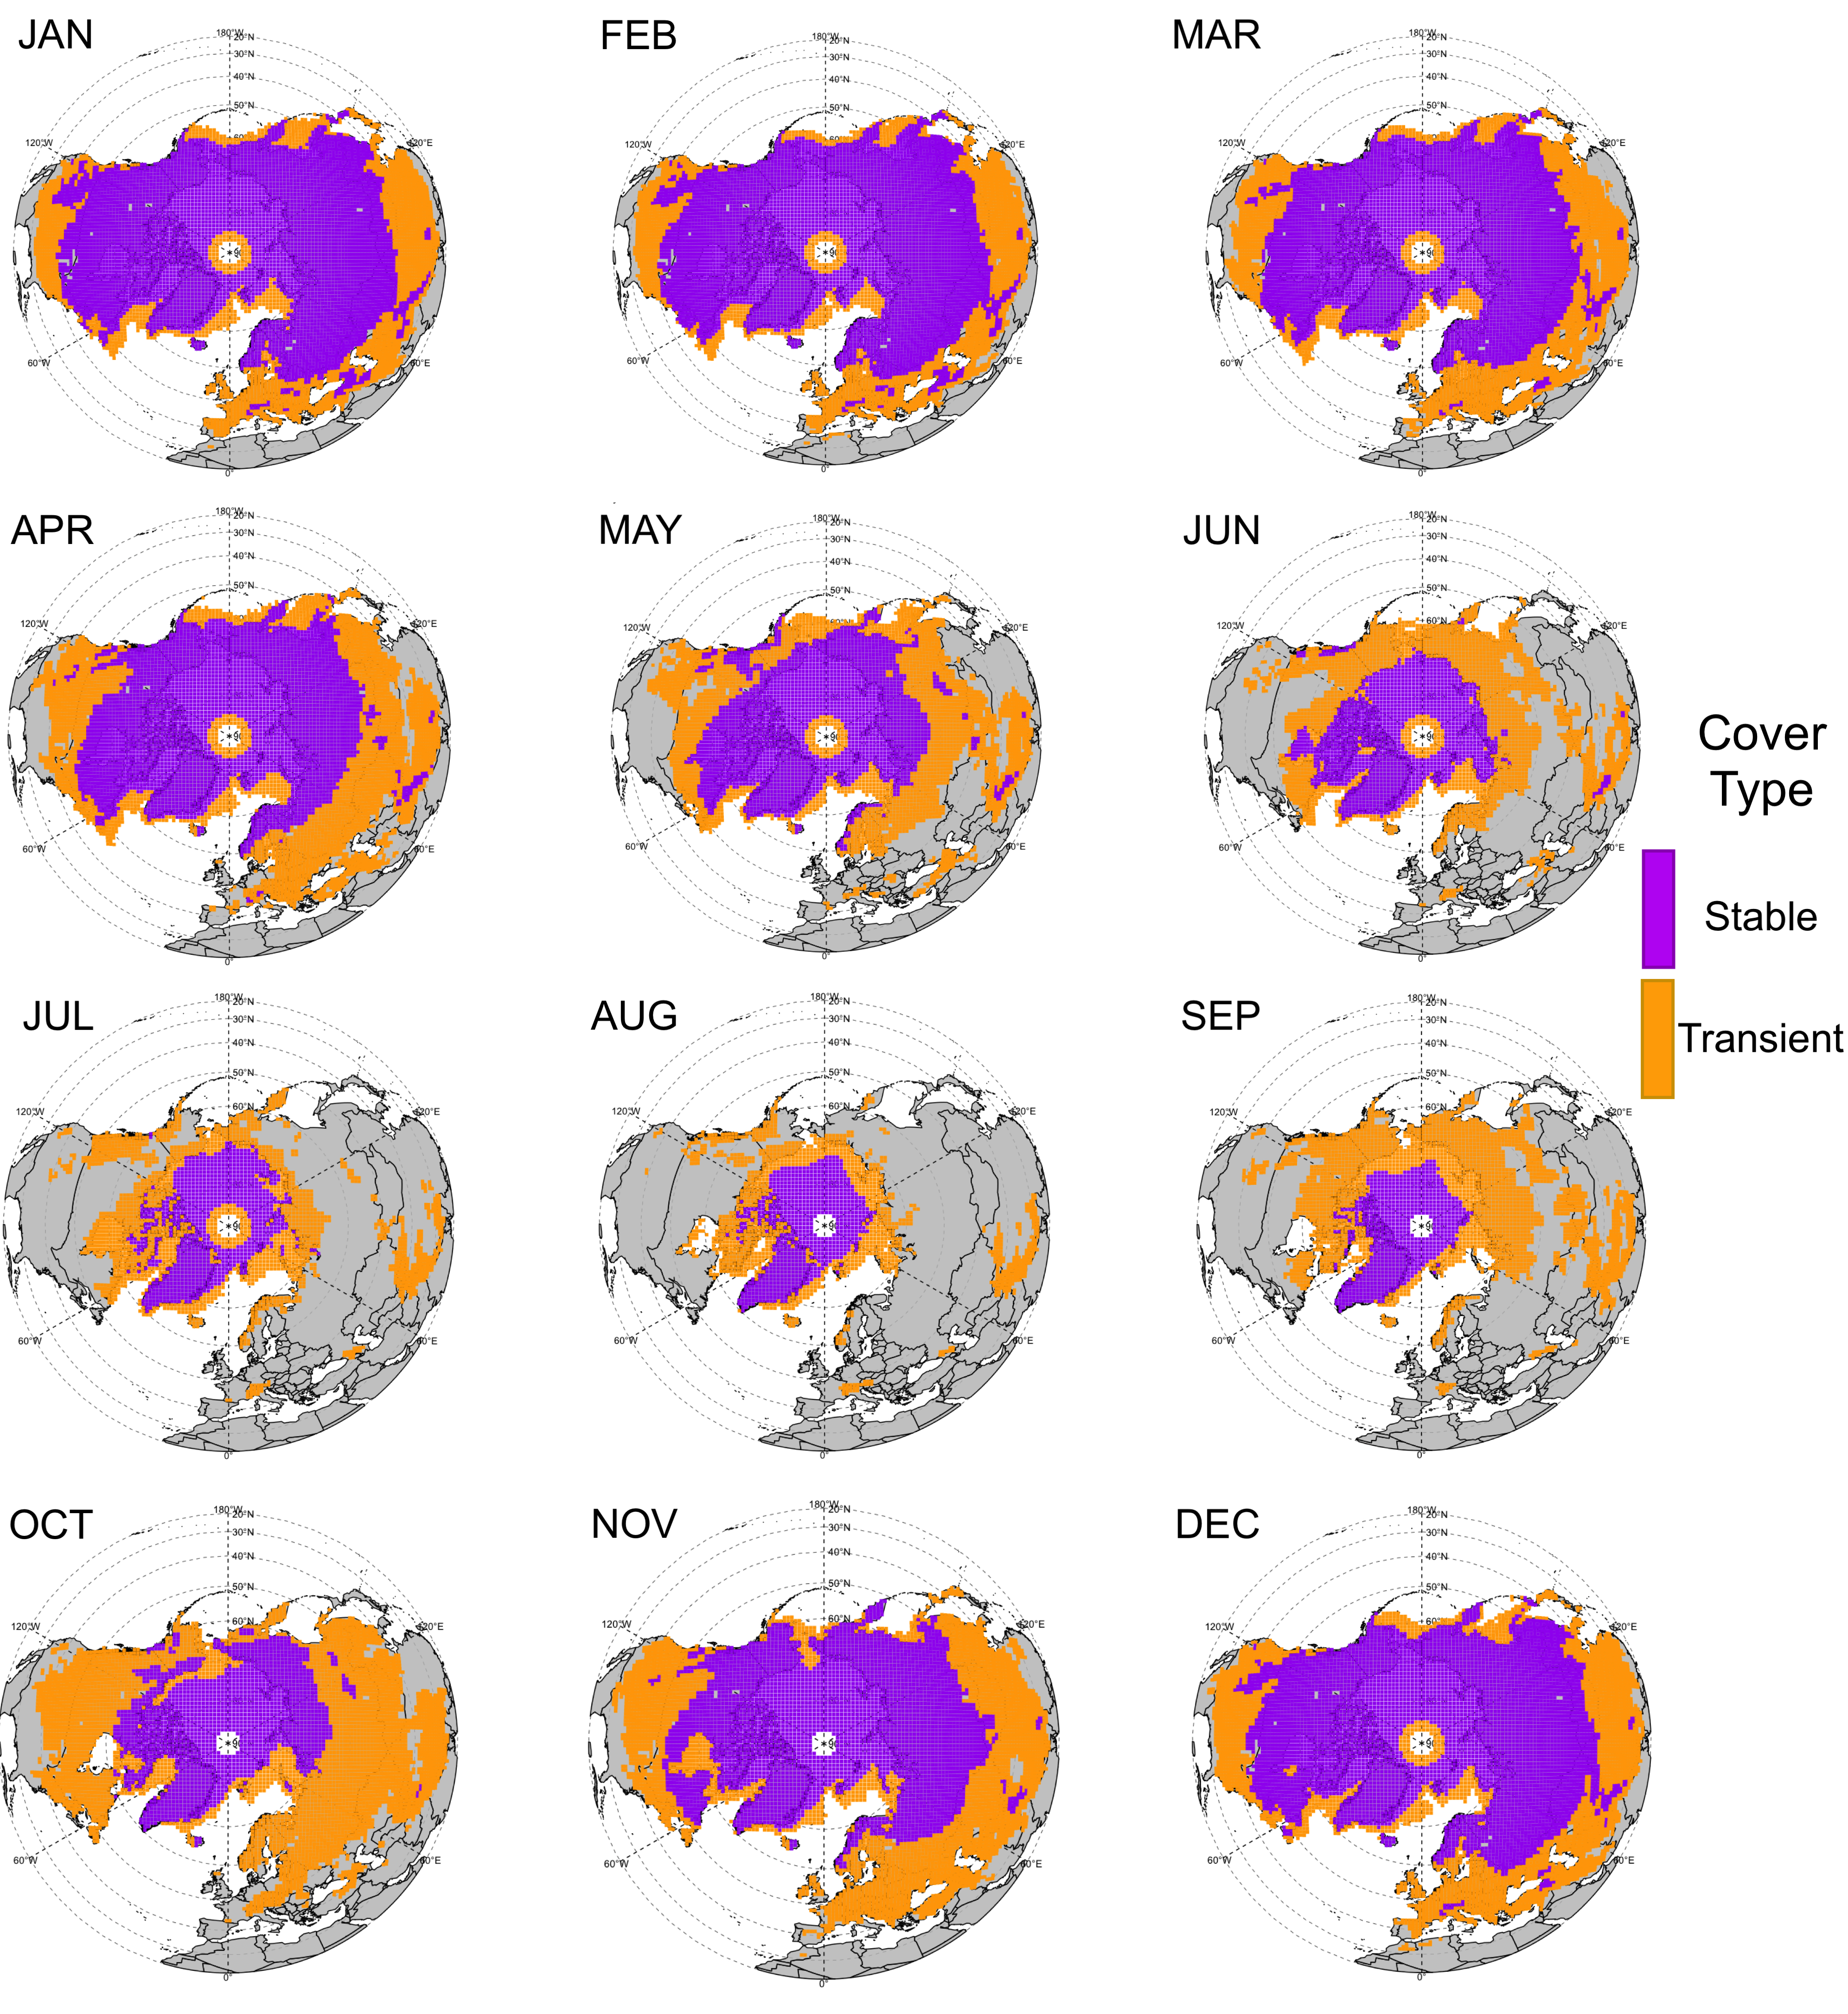
Temporal trends of cryo-cover, both as a combined variable and as separate snow and ice components, were calculated on an annual and monthly basis. Using derived cryo-cover concentration values, pixels were categorized to be either stable (covered 75% of the time or more) or transient (covered <75% of the time) to differentiate the type of cryo-cover present and transitions from one cover type (stable or transient) to the other.
Results indicated a decrease in cryo-cover since 1979 with sea ice decreasing in all months, but snow cover increasing in the autumn and early winter and decreasing during the spring.
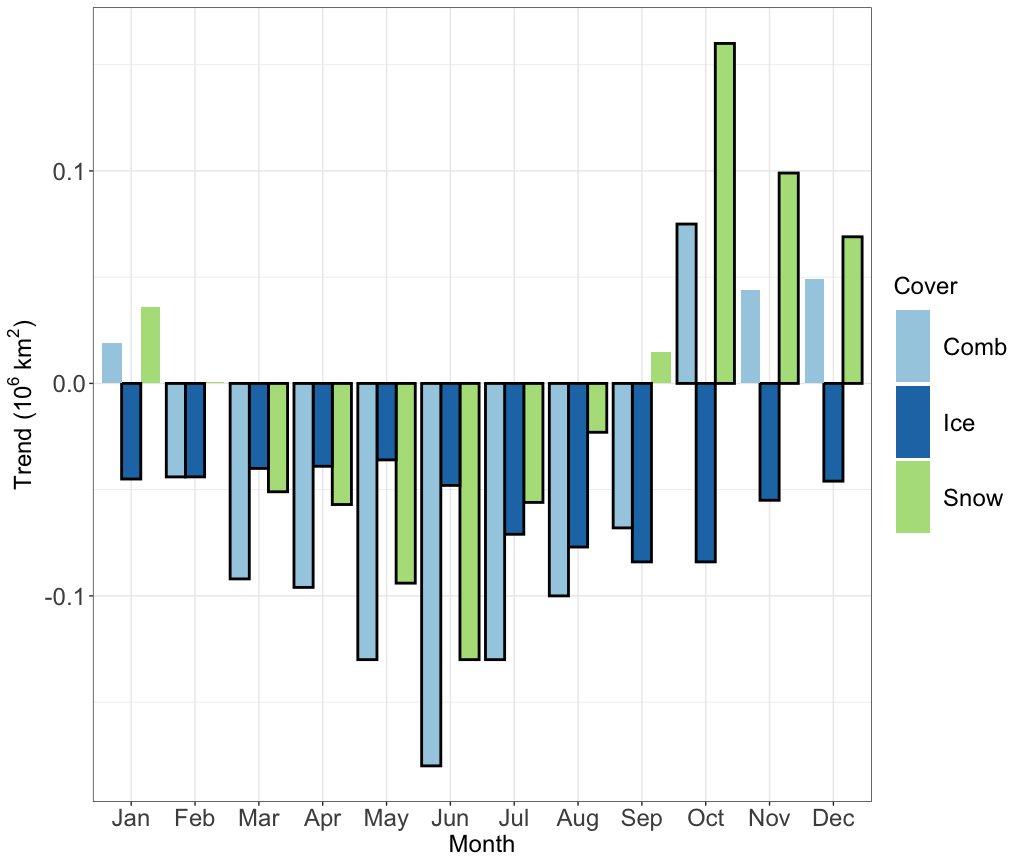
Decreasing trends in stable cryo-cover are observed during most months with several months seeing increases in transient cover. Increases in autumn snow cover (particularly in October) help to offset the large decreases in late summer/early autumn sea ice. From April to August, cryo-cover exhibits statistically significant decreasing trends.
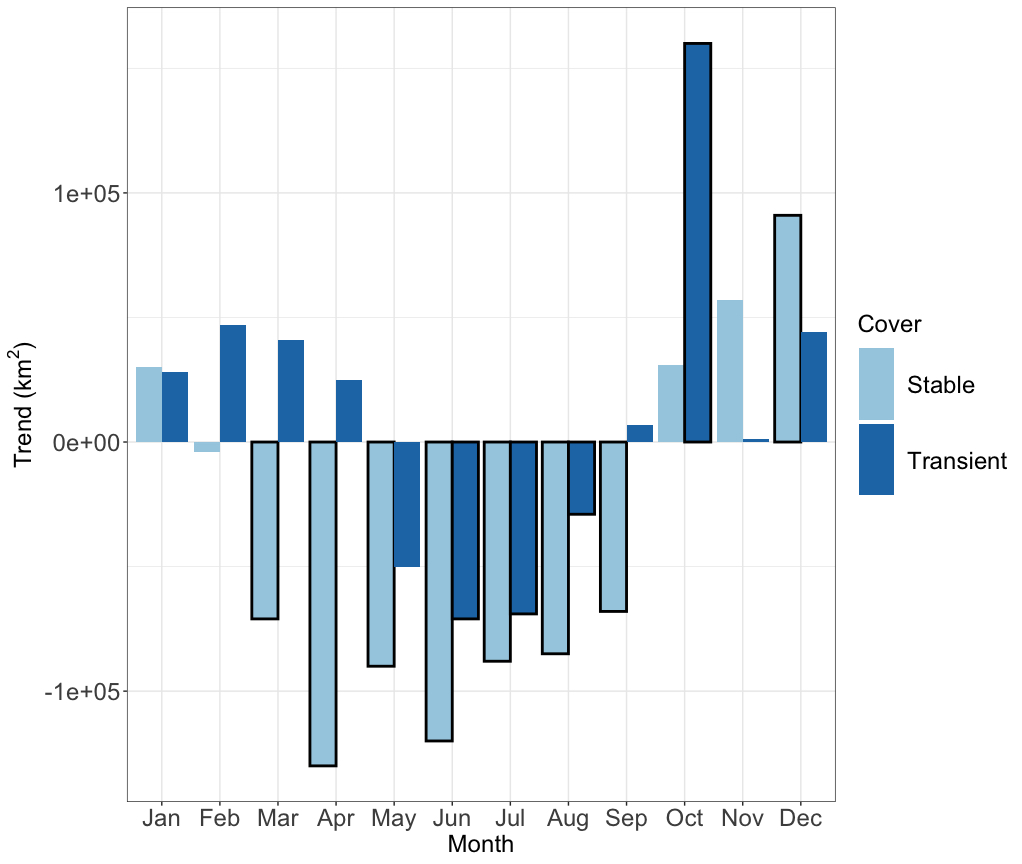
Stable cover has decreased significantly from March to October and has increased significantly in December. Transient cover has decreased significantly from June to August and increased significantly in October and February. In most months, the trend (whether it is positive or negative) is larger for stable cover than it is for transient cover (October being the exception).
As the year gets progressively cooler, and the cryo-cover has had a chance to stabilize, the trends are more comparable, before stable cover becomes larger as temperatures begin to warm again. At this point, it is less likely for new cryo-cover to be formed (as insolation is higher), resulting in negative trends to be more biased toward the stable cover.
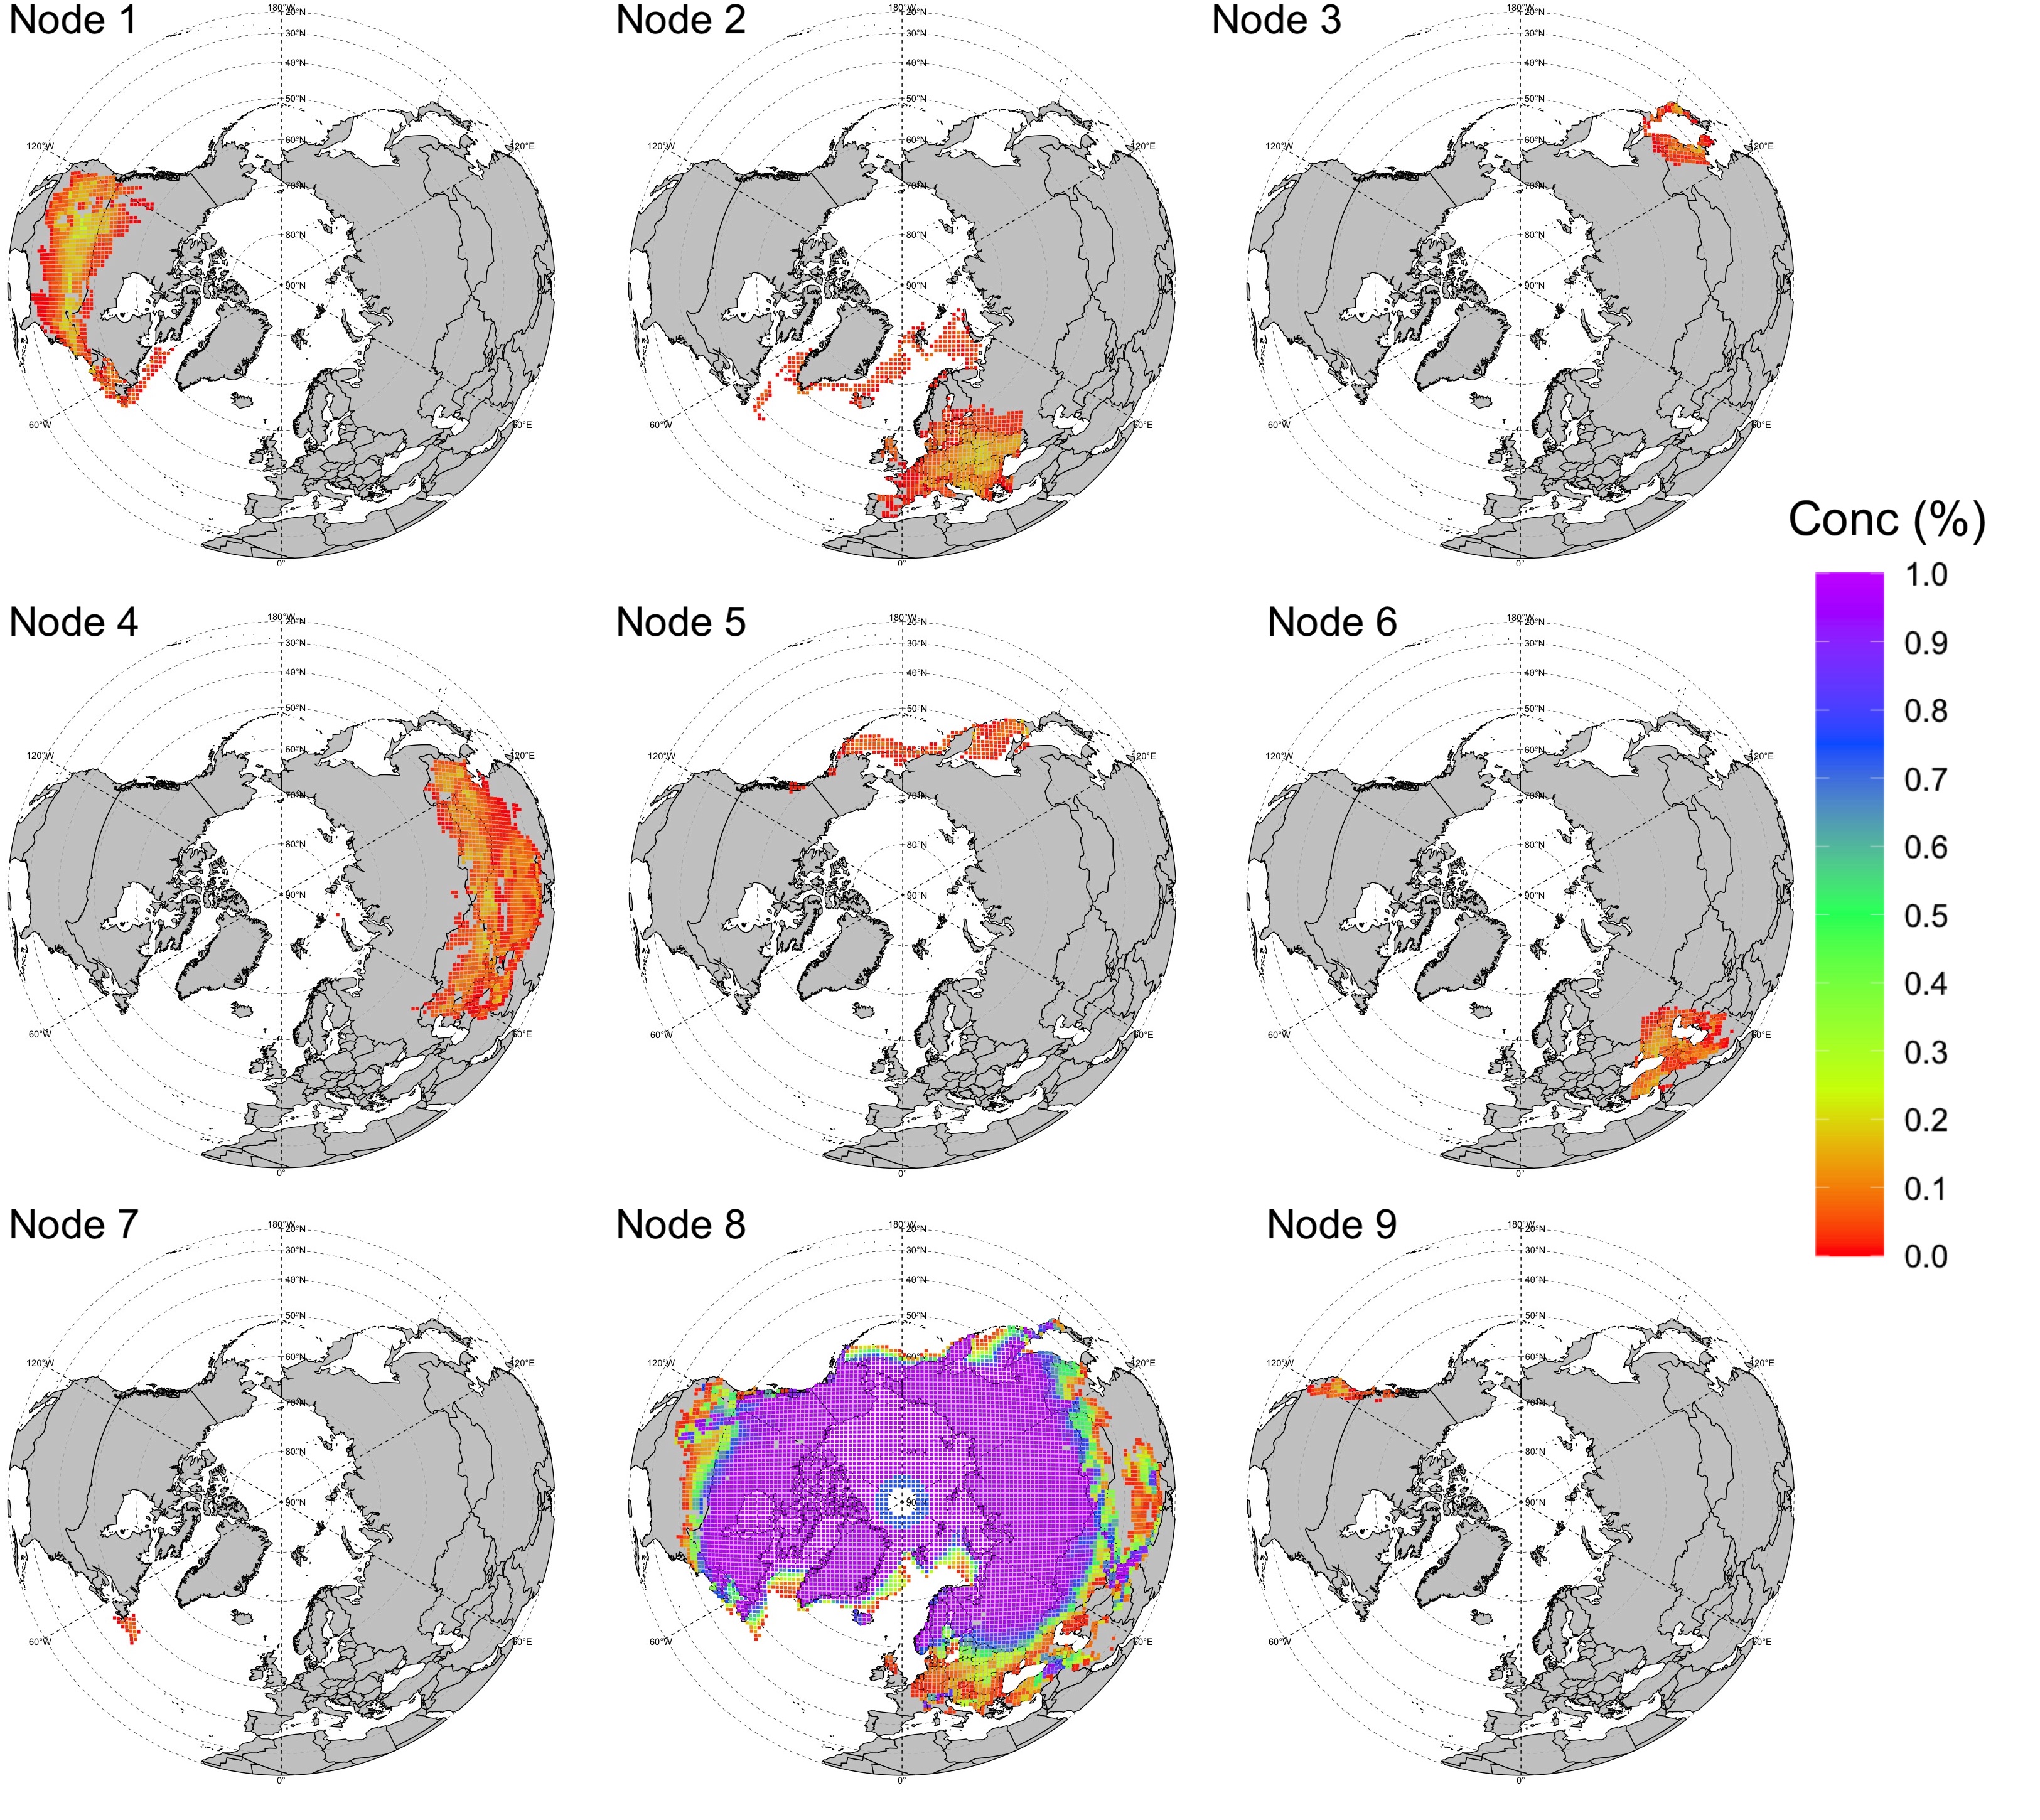
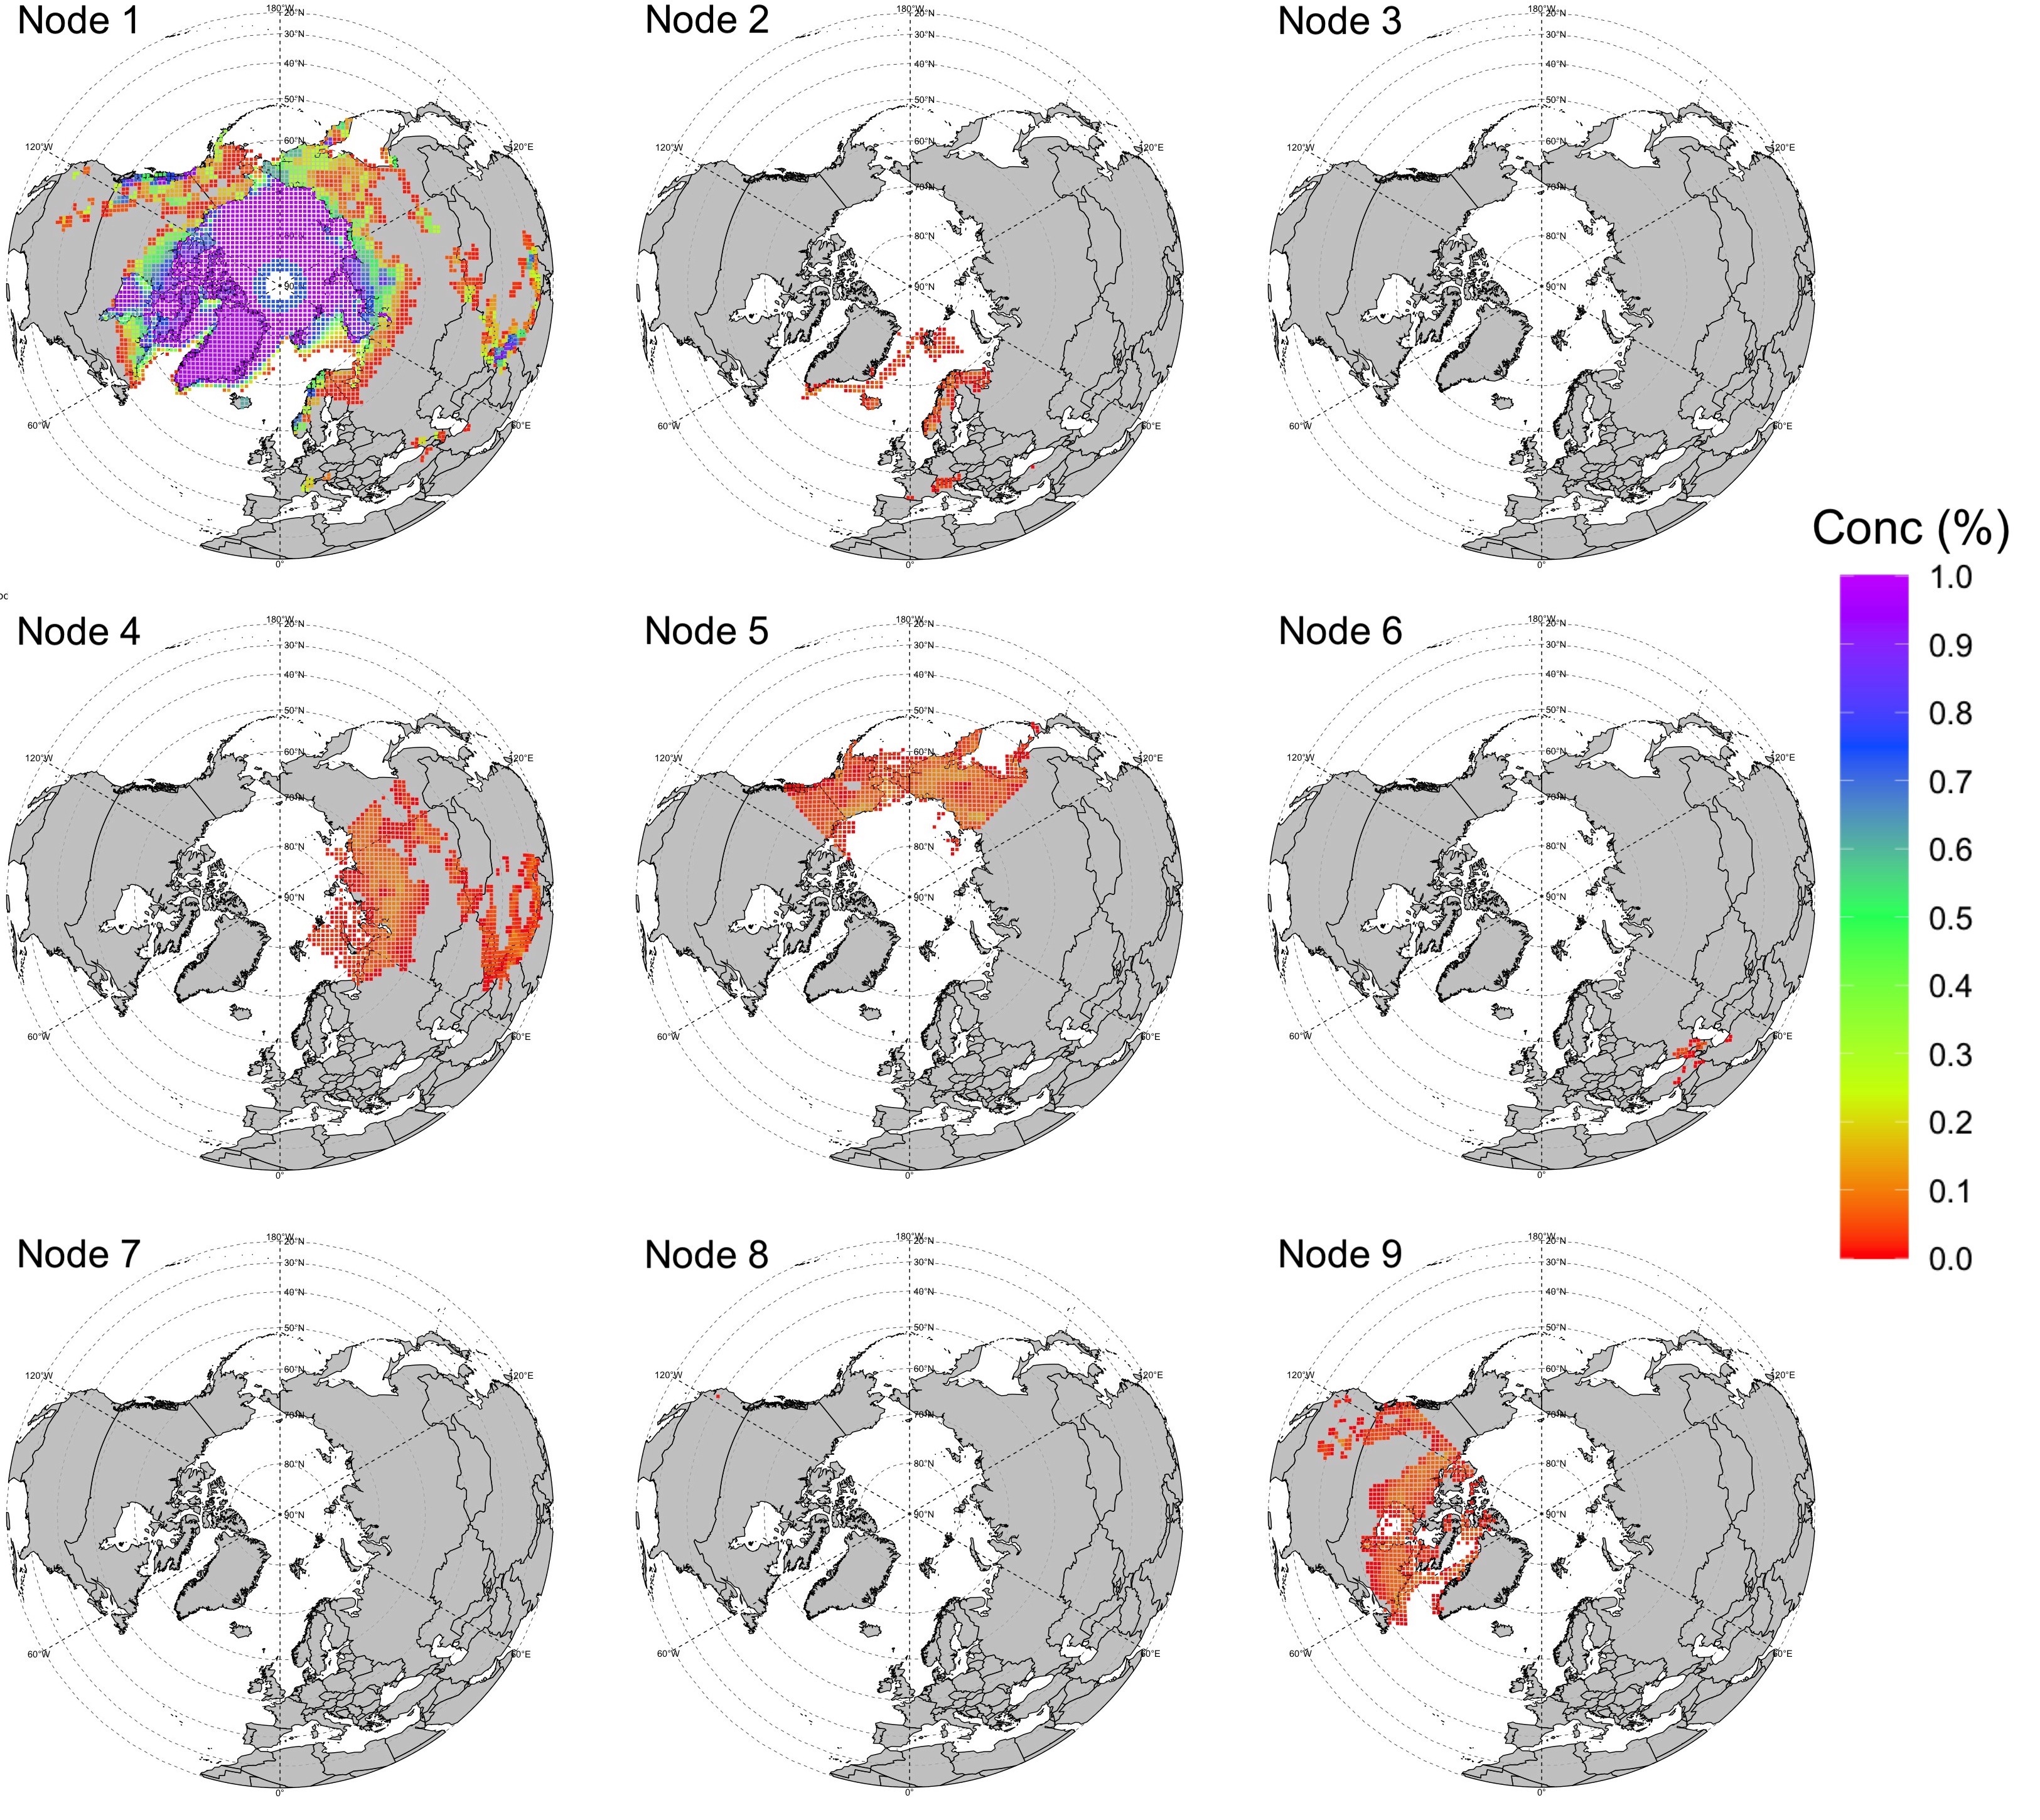
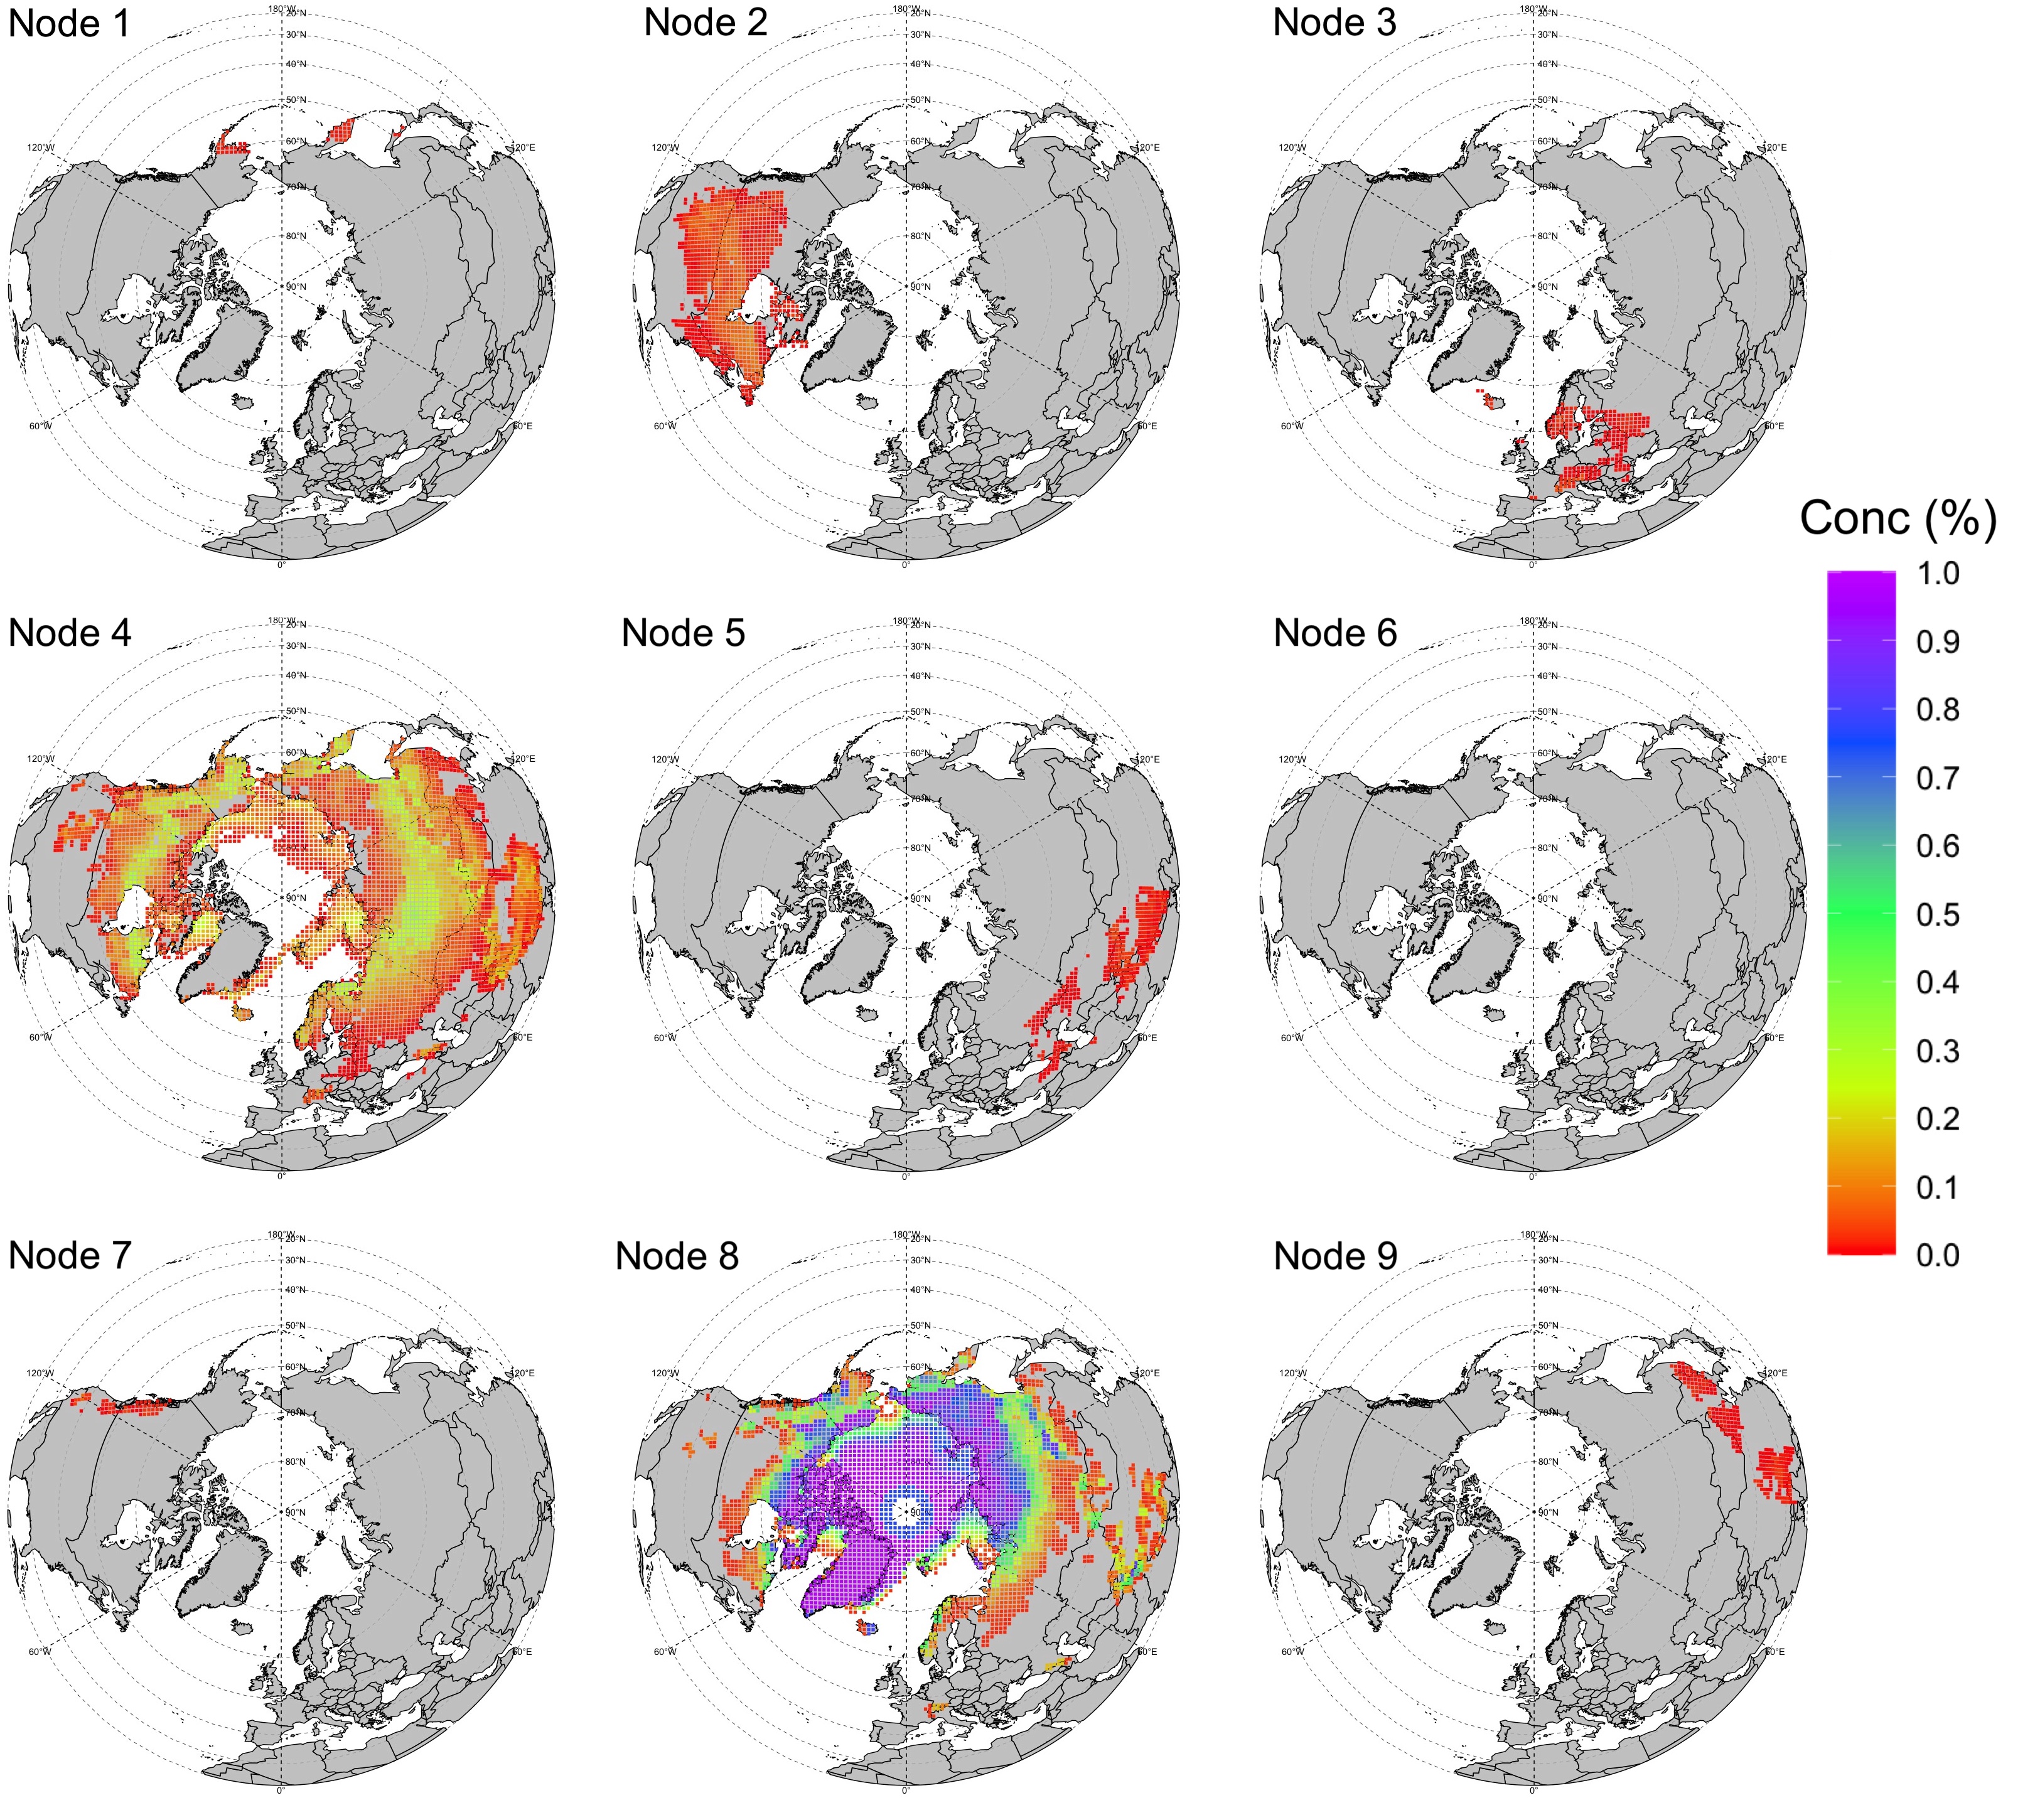
To better understand these transitions, three transitional months of cryo-cover transformation, March, June and October were analyzed using the MeaSuREs derived cryo-cover concentration dataset. Cryo-cover transformation was analyzed on a regional and hemispheric basis with trends calculated for all areas identified by SOMs (Self-Organizing Maps, Kohonen 1988).
SOMs are often used as a substitute for a traditional cluster analysis. Like cluster analysis, a SOM will place data points in a user defined number of clusters (referred to as “nodes”).
However, SOMs (unlike cluster analysis) do not rely on linearity or on the data conforming to a specific distribution and nodes that are closer together on the map have more in common than those that are farther apart (unlike traditional clusters). The SOM output for the three months is in the three-panel figure below, where each map is an averaged node.
Results suggest cryo-cover decreases (in area and stability) during March and June as pixels shift from SOM identified stable patterns to more transient patterns. October results suggest increases in transient cryo-cover, a result of declining stability in sea ice but also increasing snow cover predominantly centered around 50 °N latitude.
All months experience regions of increasing and decreasing cryo-cover trends. Decreasing trends are pre- dominant in March and June, although some areas of increase are apparent even during these months. By contrast, October has significant area experiencing increasing trends in cryo-cover, as well as large decreasing trends in the ice domain.
Although the cryosphere is often discussed in its separate components (largely sea ice and snow cover), and in large regional terms (North America and Eurasia), better specification of the smaller regional cryo-cover patterns will be imperative to studying how cryo-cover will change with rising temperatures and how it may influence the atmosphere and radiation budget throughout its transitions.
Determining specific regions that vary in a synergistic way, and perhaps are also influenced by similar mechanisms (be it specific teleconnections or otherwise) will be a key component in understanding the radiative impacts of a changing cryosphere in a warming climate.
