Precipitation Magnitude and Frequency

As the planet warms, there is a direct influence on precipitation, as the warmer temperatures allow increased evaporation and drought while simultaneously increasing the saturation vapor pressure of the atmosphere. Across the United States, most trends in the 2-, 5-, and 10-year return period rainfall amounts are positive (implying an increased number of storms previously thought to be “rare”).
The impacts of shifting water regimes vary considerably across space, where local features and geographic location are key components in hydroclimatic change. As such, each study area is unique, and must be analyzed as such. As climate continues to trend hotter, water availability changes and precipitation implications are still actively being discovered and researched.
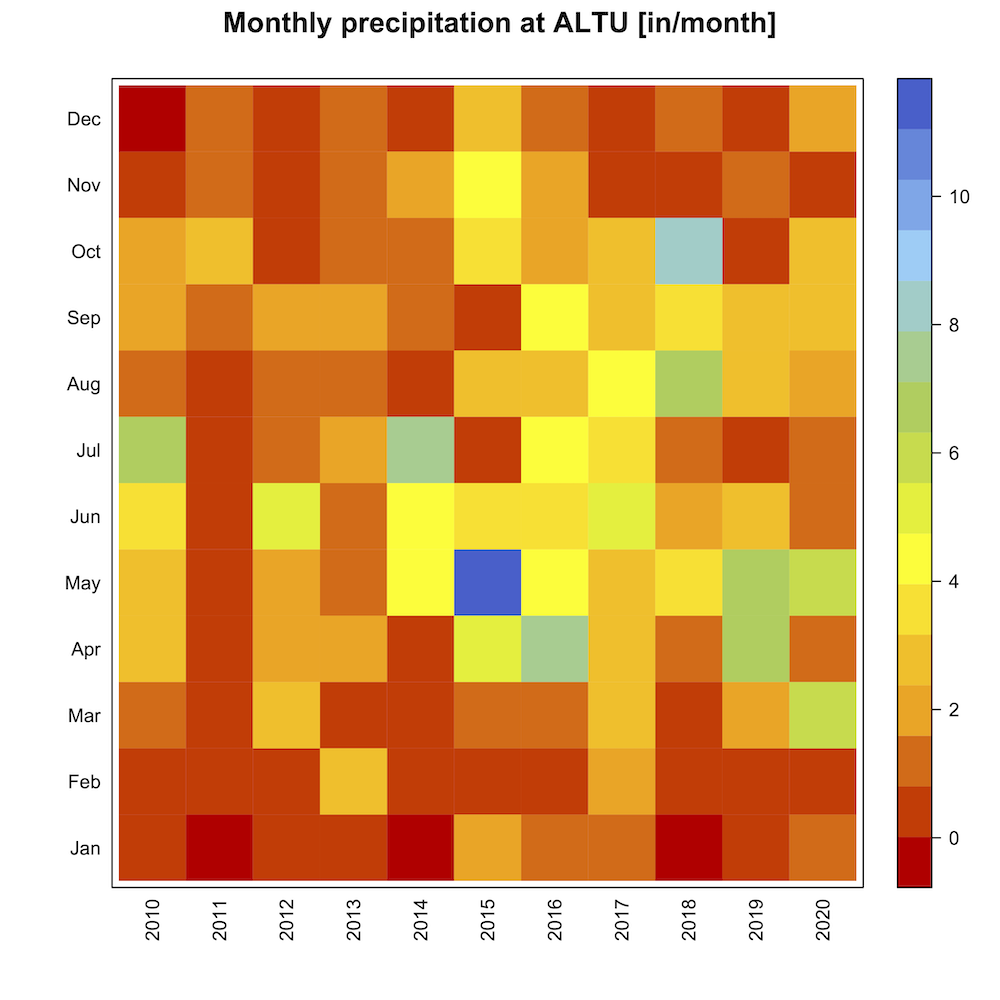
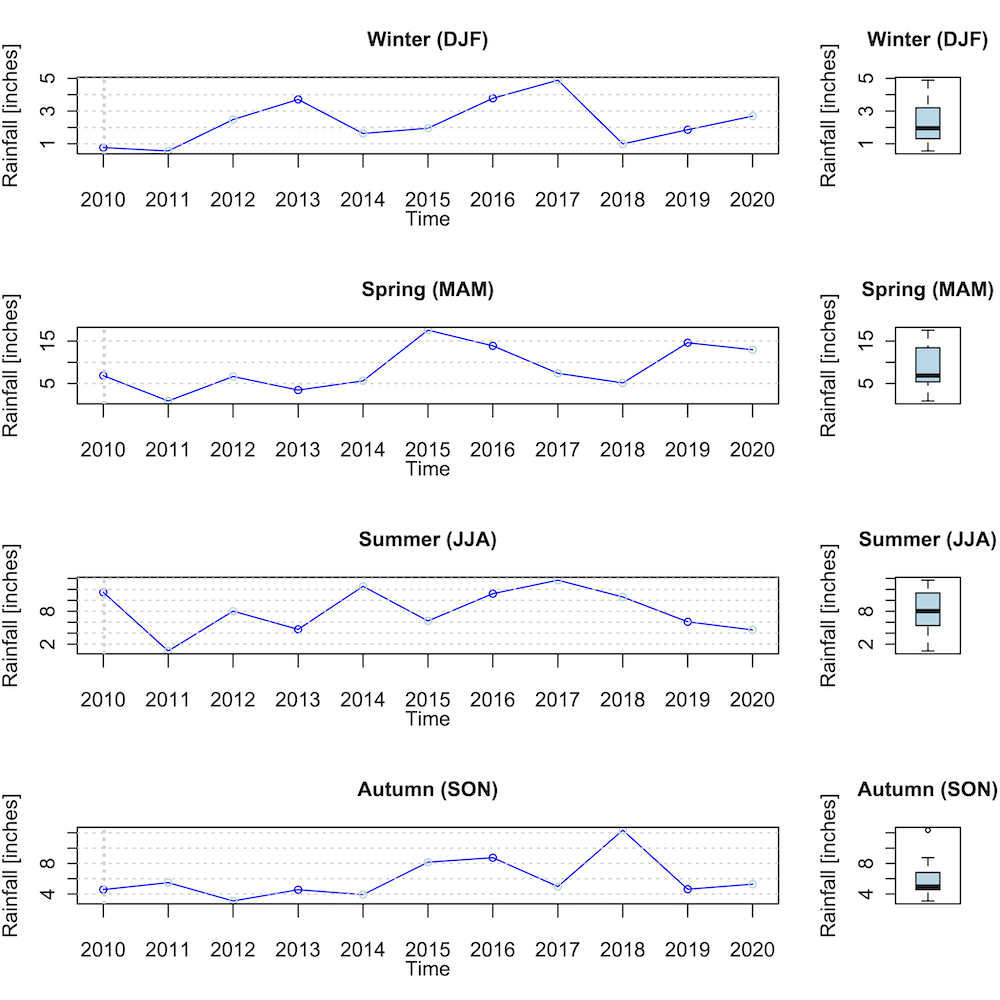
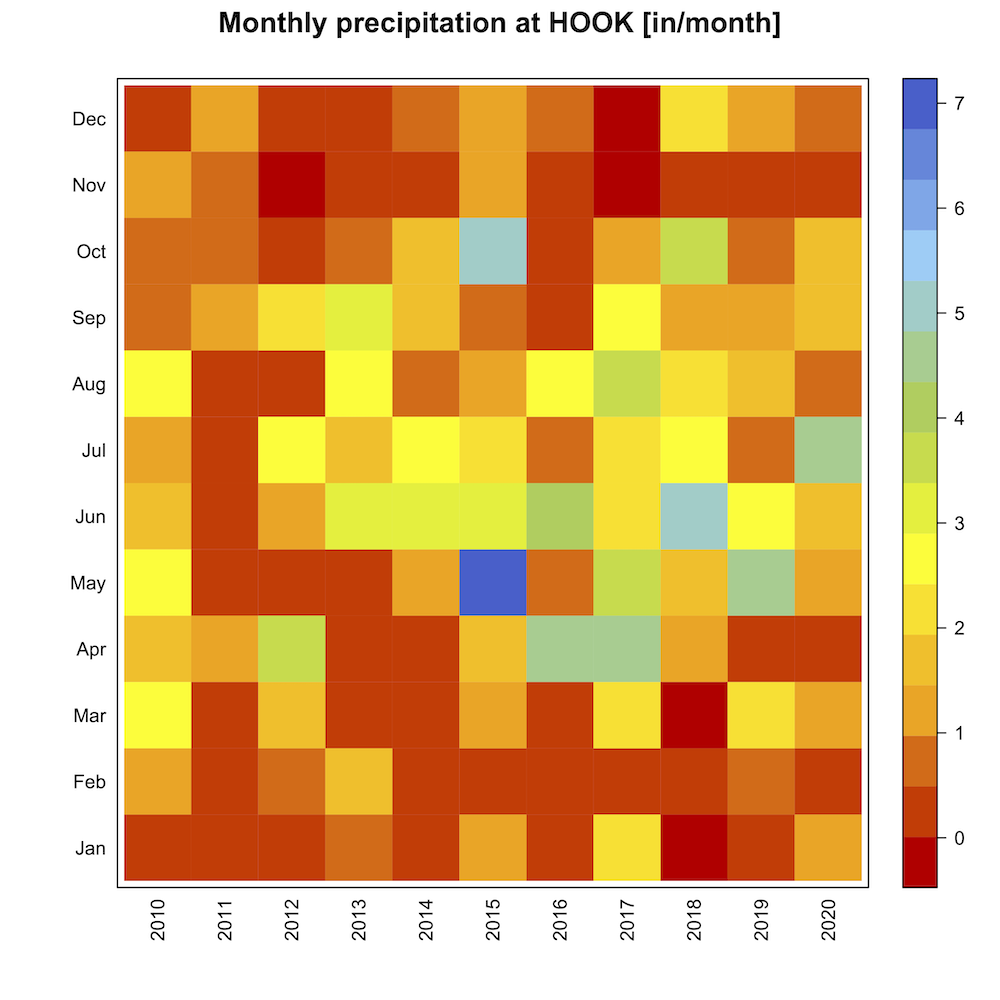
Hydroclimatic extremes are both of interest for their changes in recent years as well as the societal hazards attributed to them. The lab is currently studying Oklahoma’s unique hydroclimate in relation to water availability.
Oklahoma relies on different water sources dependent on where one is located within the state; the western half of the state relies more heavily on groundwater sources, while the eastern half relies predominantly on surface water from local streams and lakes. In addition, there is a steep gradient in precipitation received across the state decreasing from east to west, further complicating water access and recharge.
By incorporating the atmospheric component (precipitation trends in frequency and magnitude, temperature changes) as well as a hydrologic component (stream flow measurements and well level data) the group hopes to better assess the current hydroclimate of the state, as well as use synoptic climatological methods to better situate Oklahoma’s hydroclimate under different climate scenarios.
Through an analysis of precipitation frequency and magnitude, as well as the atmospheric situations that lead to high-impact events, a better understanding of how groundwater reserves and surface water levels will be influenced under changing climate regimes can be gained for future decision-making.
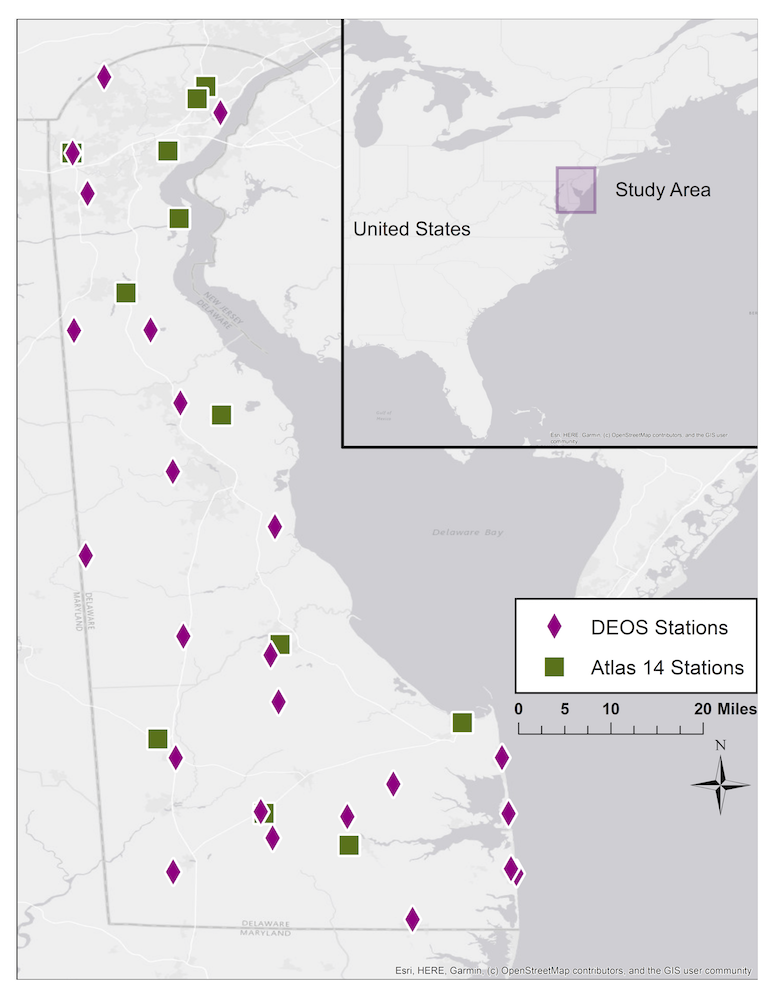
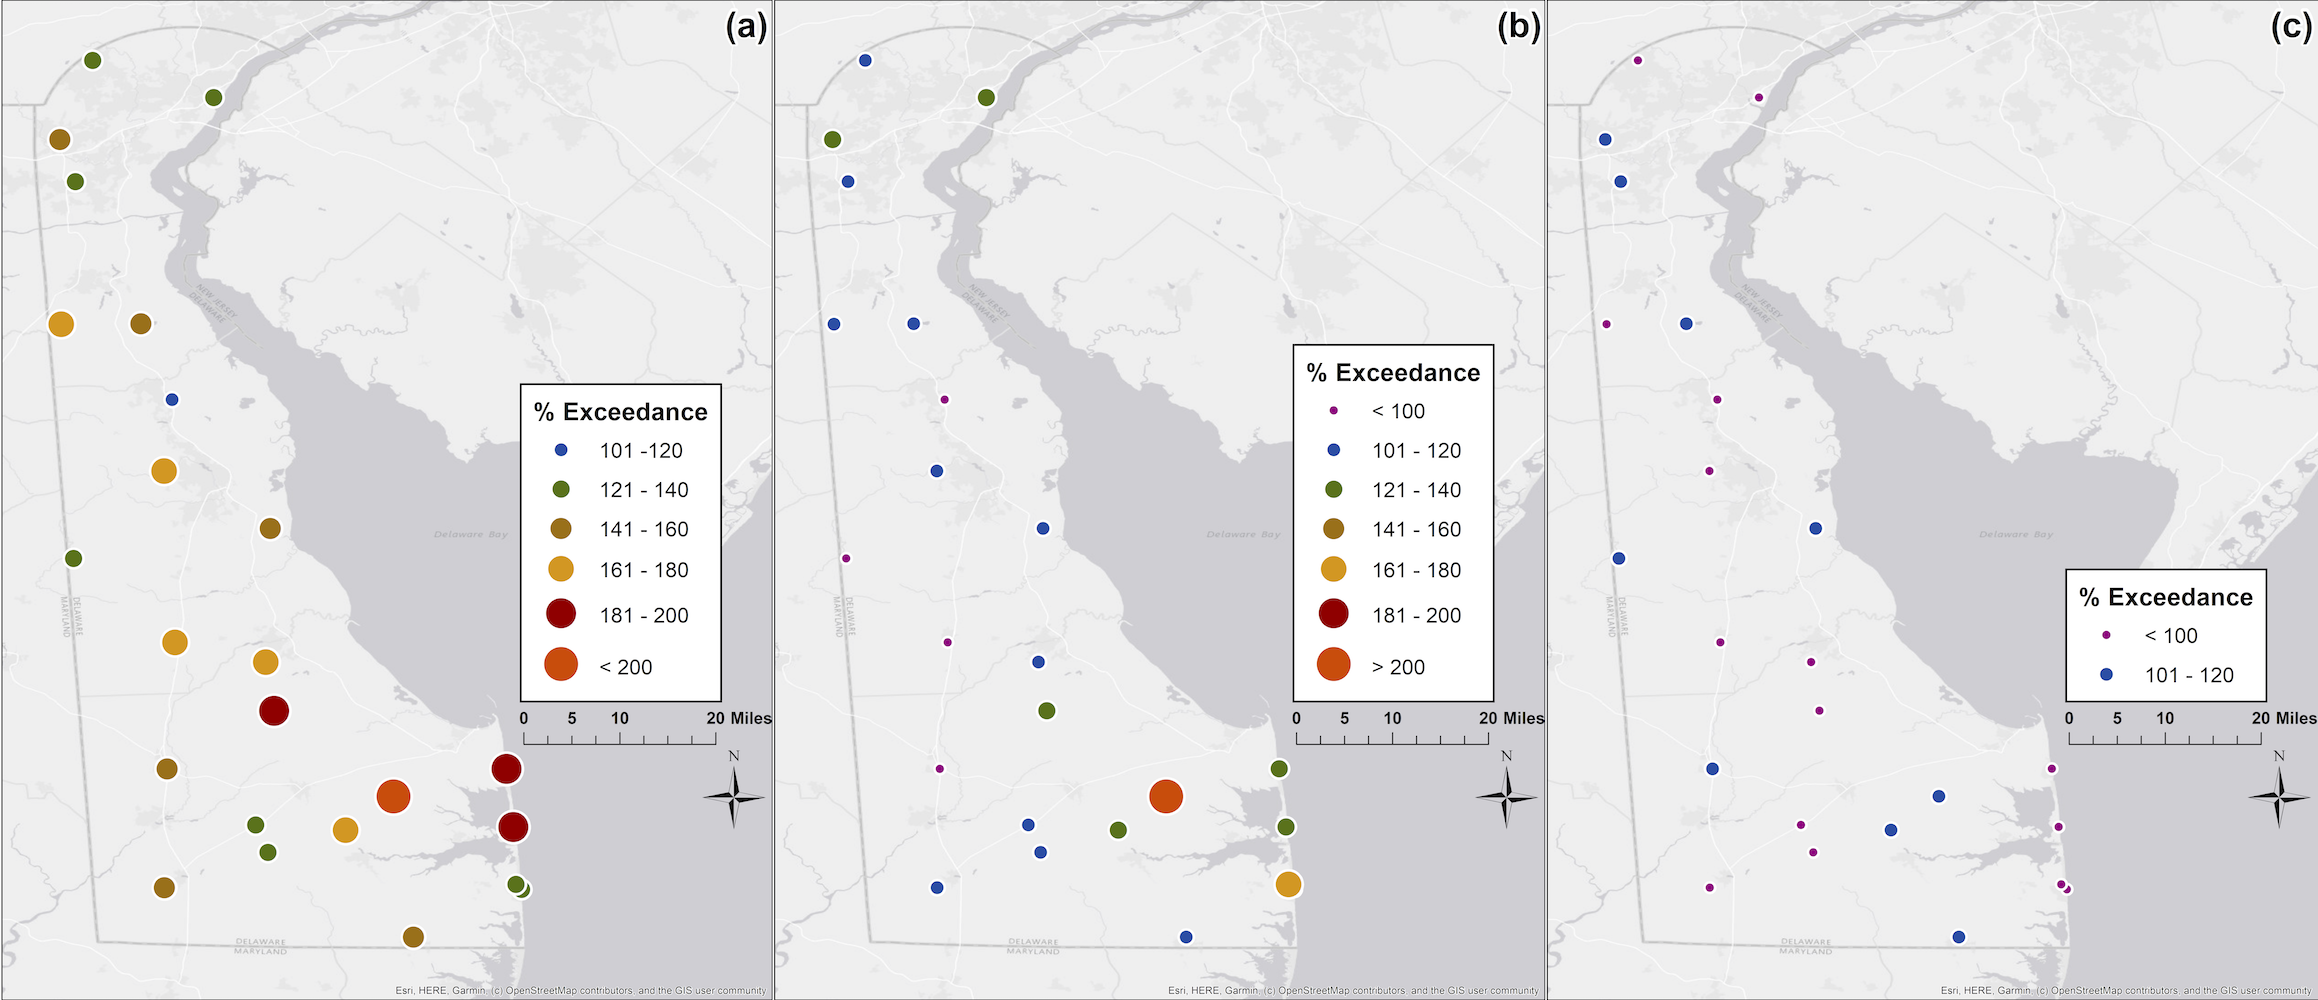
Previous work assessed the accuracy of the commonly used decision-making tool Atlas 14 in Delaware. The NOAA Atlas 14 product is the nation's standard for estimating the magnitude and frequency of site-specific extreme precipitation events.
The Atlas uses surface stations, primarily from the National Weather Service Cooperative Observer Program, and statistical methodologies to provide point-based precipitation exceedance probability estimates for several durations and potential recurrence intervals. Unfortunately, the number and quality of Cooperative Observer sites varies greatly over space and time.
We compared observed precipitation extremes from a high-resolution statewide mesonet to those estimated by the Atlas 14 product for a 10-year recurrence interval at several precipitation durations. Results of the analysis indicate that Atlas 14 underestimates the number and magnitude of extreme precipitation events across the state of Delaware at longer event durations (360- to 1,440-min).
At shorter durations (5- to 240-min) the Atlas 14 estimates were more closely aligned. 100% of exceedance events in the 5-, 10-, 30-, and 60-min durations are a result of convective storms, while events of 120-, 180-, 360-, 720-, and 1,440-min are associated with tropical and mid-latitude cyclones.
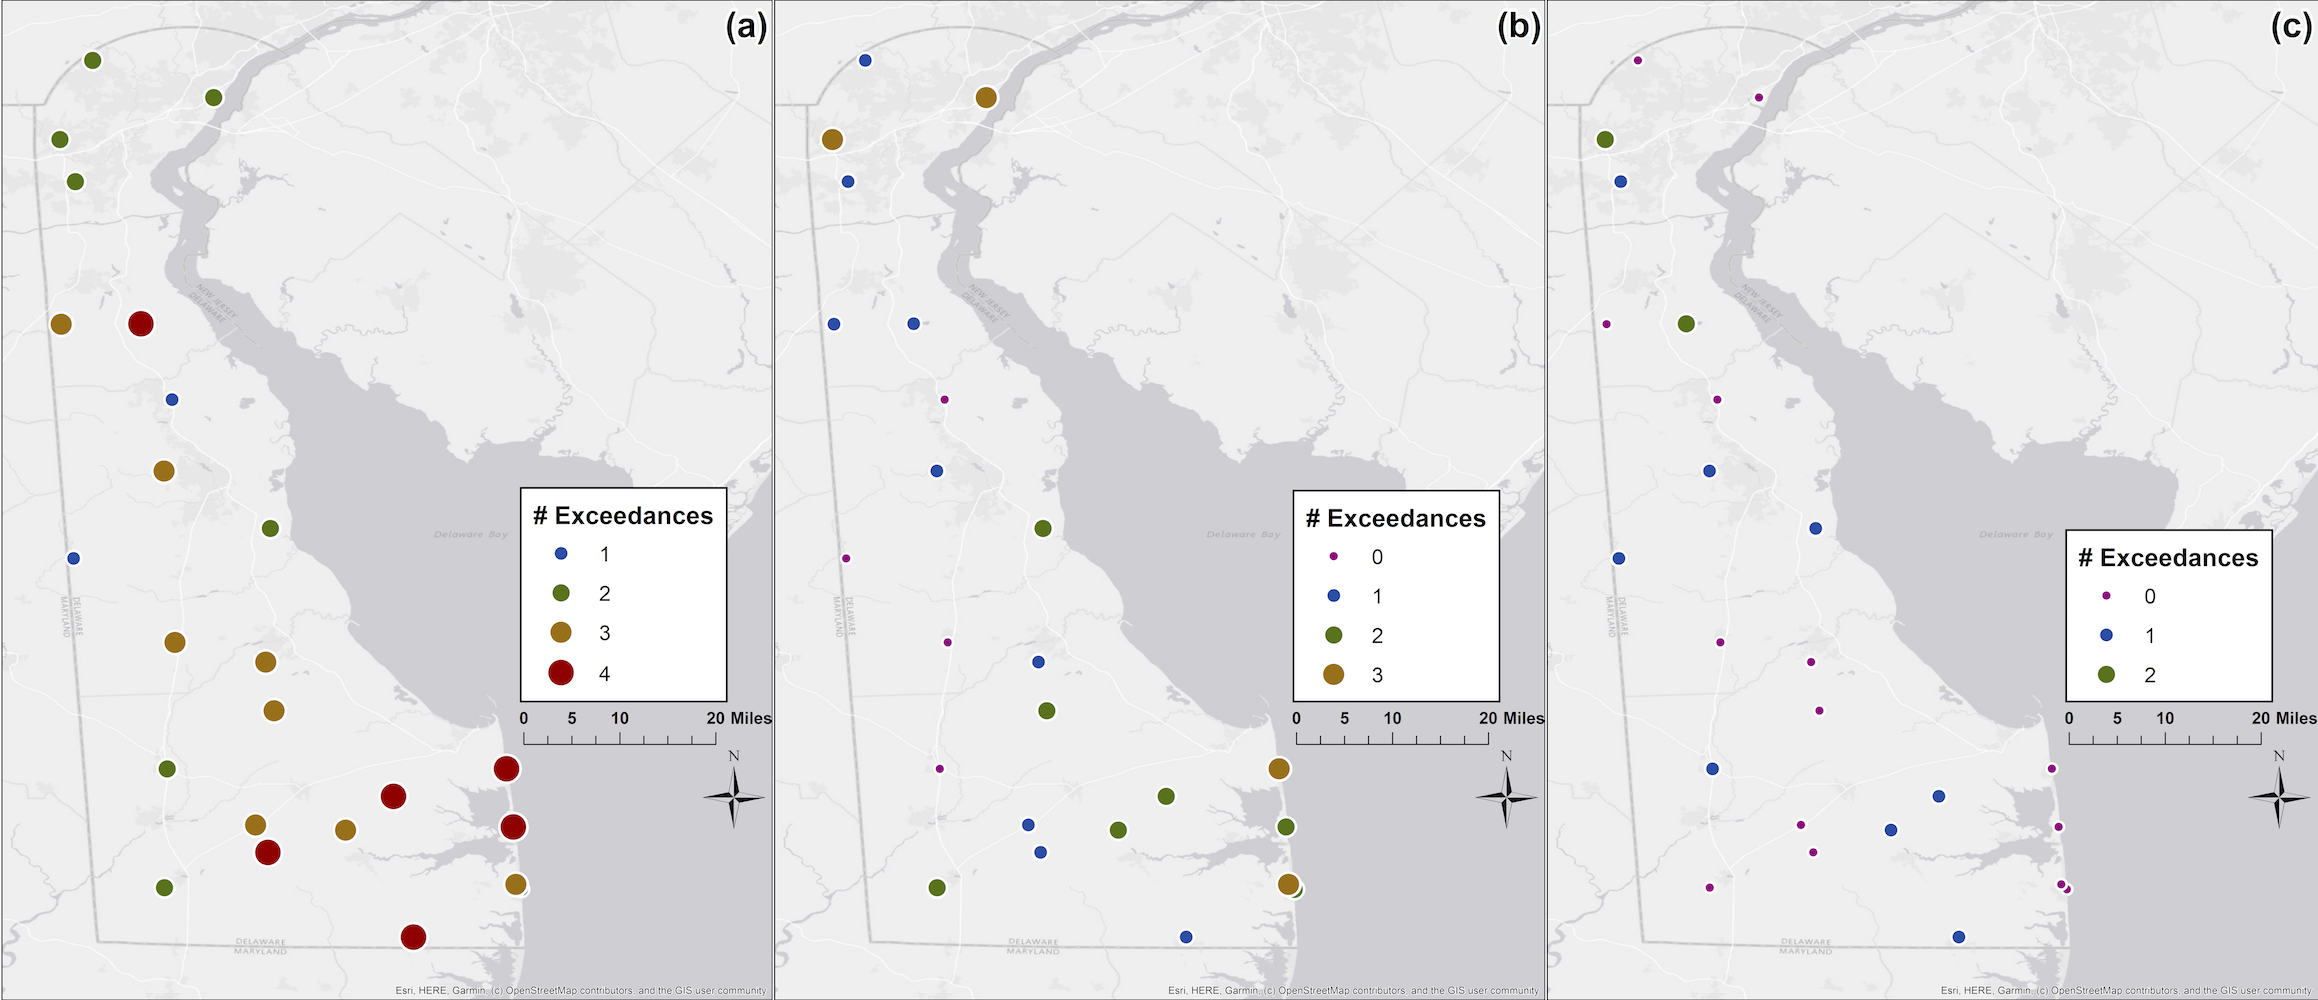
Thus, the Atlas 14 product seems to be underestimating the magnitude of cyclonic (tropical or extratropical) extreme precipitation events more than the magnitude of extreme convective events.
These results suggest that caution should be exercised when using Atlas 14 estimates for engineering standards and hydrologic studies, especially for longer duration events. We suggested a more rapid update cycle for revision of the Atlas 14 product as changing climate regimes may have led to the differences.
