Agriculture and Water Resources


Hydroclimatic changes have diverse implications, dependent both on the change itself but also the societal or environmental sector being impacted. For example, changes in the eastern half of the country (where water deficits are less of an issue) are often centered on flooding or better water management, where in the western half of the country issues typically center around a lack of water, or precipitation events that are of high intensity but low frequency.
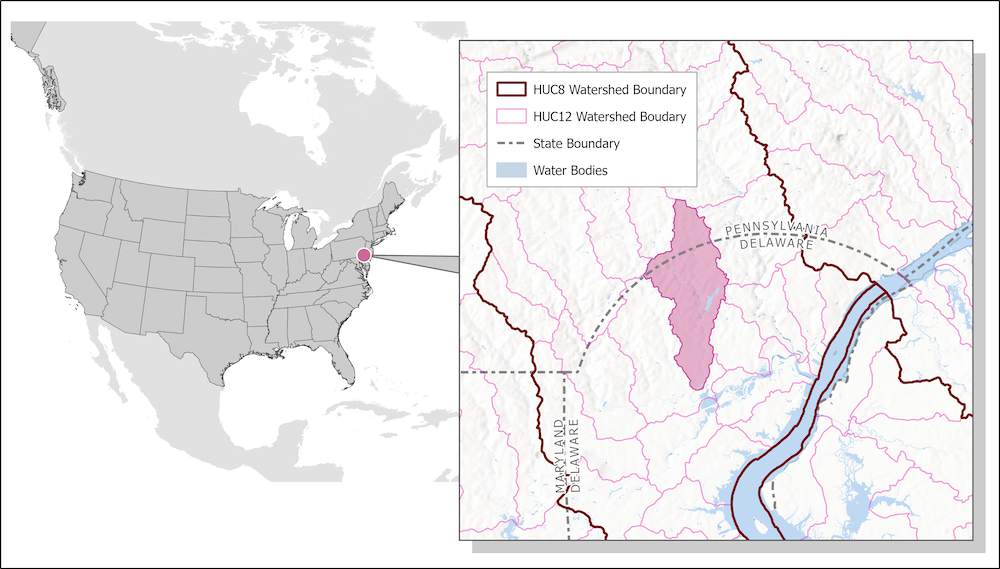
Communities that are located near major waterways (streams and rivers) and those that are dependent on agriculture for a large portion of their economies are arguably at highest risk for facing the unknown, and often hard to predict, future climate. Recent work focused on a suburban mixed land-use watershed (the Red Clay Creek) in northern Delaware to determine climatic conditions that most impacted streamflow modelling accuracy.
The reference model was the National Water Model (NWM), which is a nationwide tool still in need of validation under specific hydrologic settings and hydroclimatic conditions.
We evaluated its performance with an emphasis on the synoptic climatic conditions during high flow events. To test the NWM’s forecasting performance in the Red Clay Creek basin, we compared United States Geological Survey (USGS) observation data from three reaches on the Red Clay Creek to comparable 18-hour NWM forecast data.
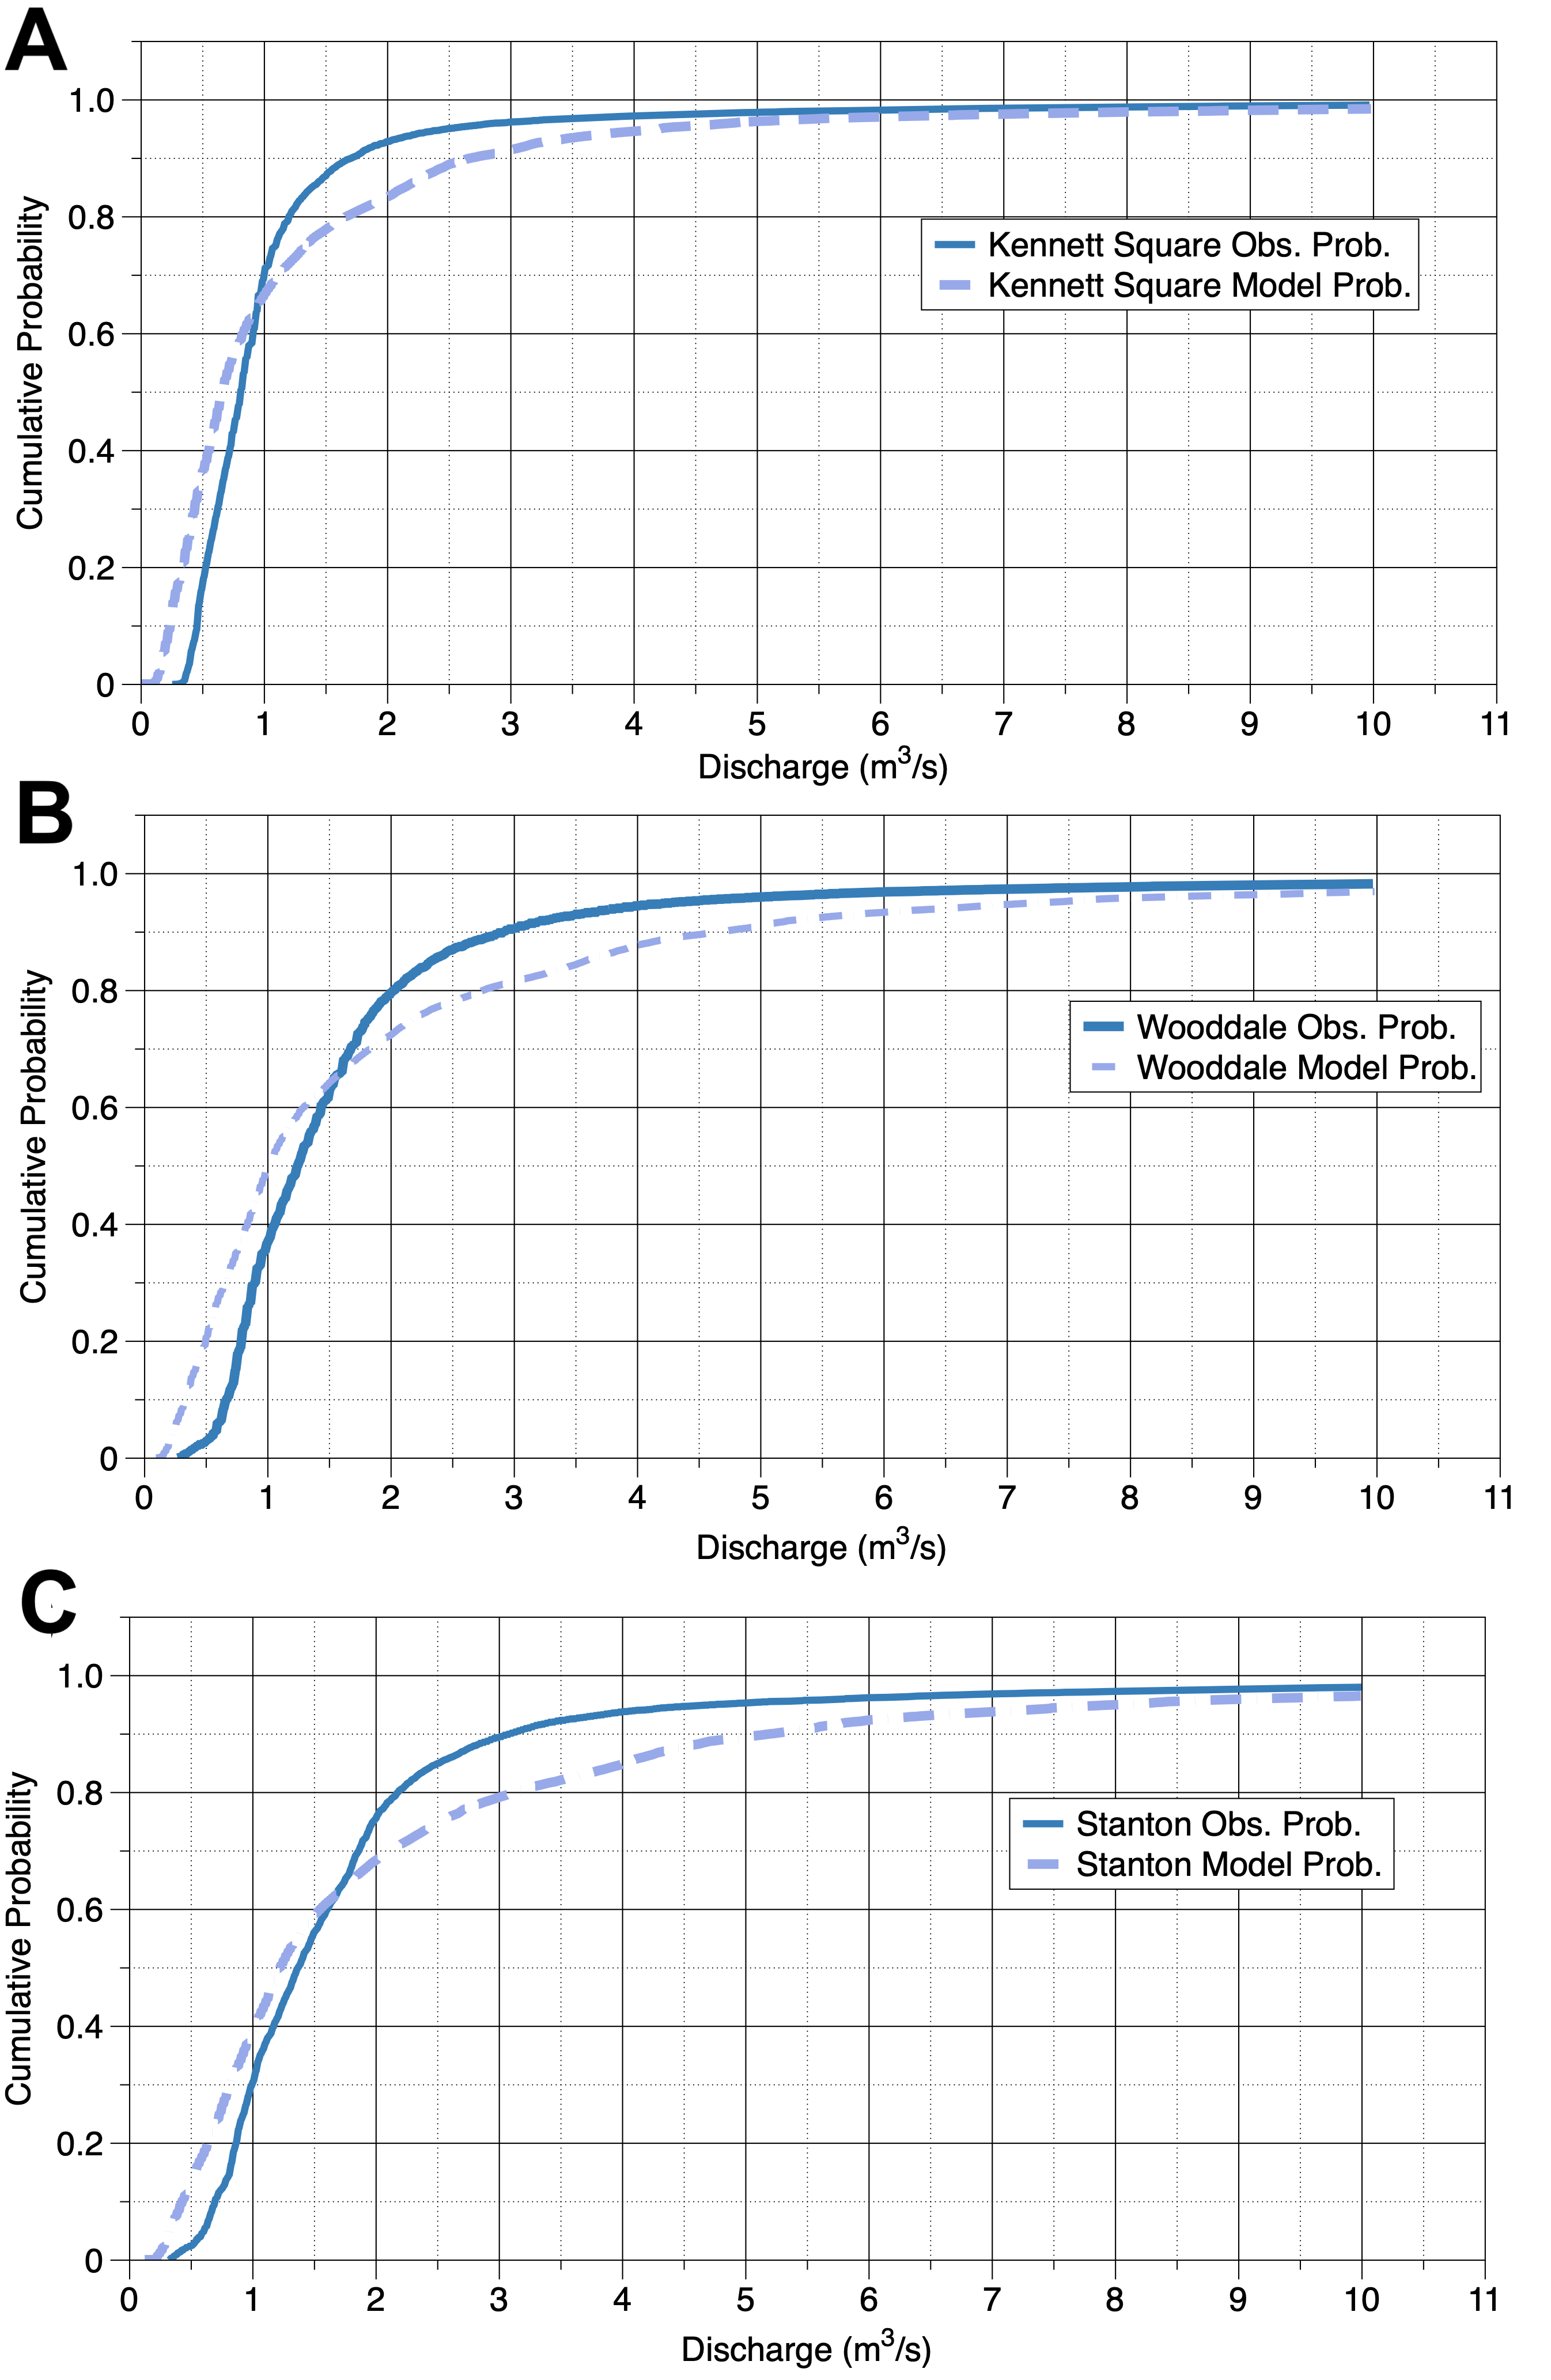
Differences in the distributions between modeled and observed data are clear with inspection of cumulative probability curves for each station (below, left). At each location the NWM generally underestimates discharge compared to observations for low flow events (< 1m3/s) and overestimates discharge for events greater than 1m3/s.
We also detailed the meteorological conditions during each flood event. It is worth noting that both convective precipitation events (those which are typically shorter but more intense in character) and mid-latitude cyclone-stratiform precipitation events (typically longer in duration but less intense) are associated with the floods and with both overestimation and underestimation by the NWM.
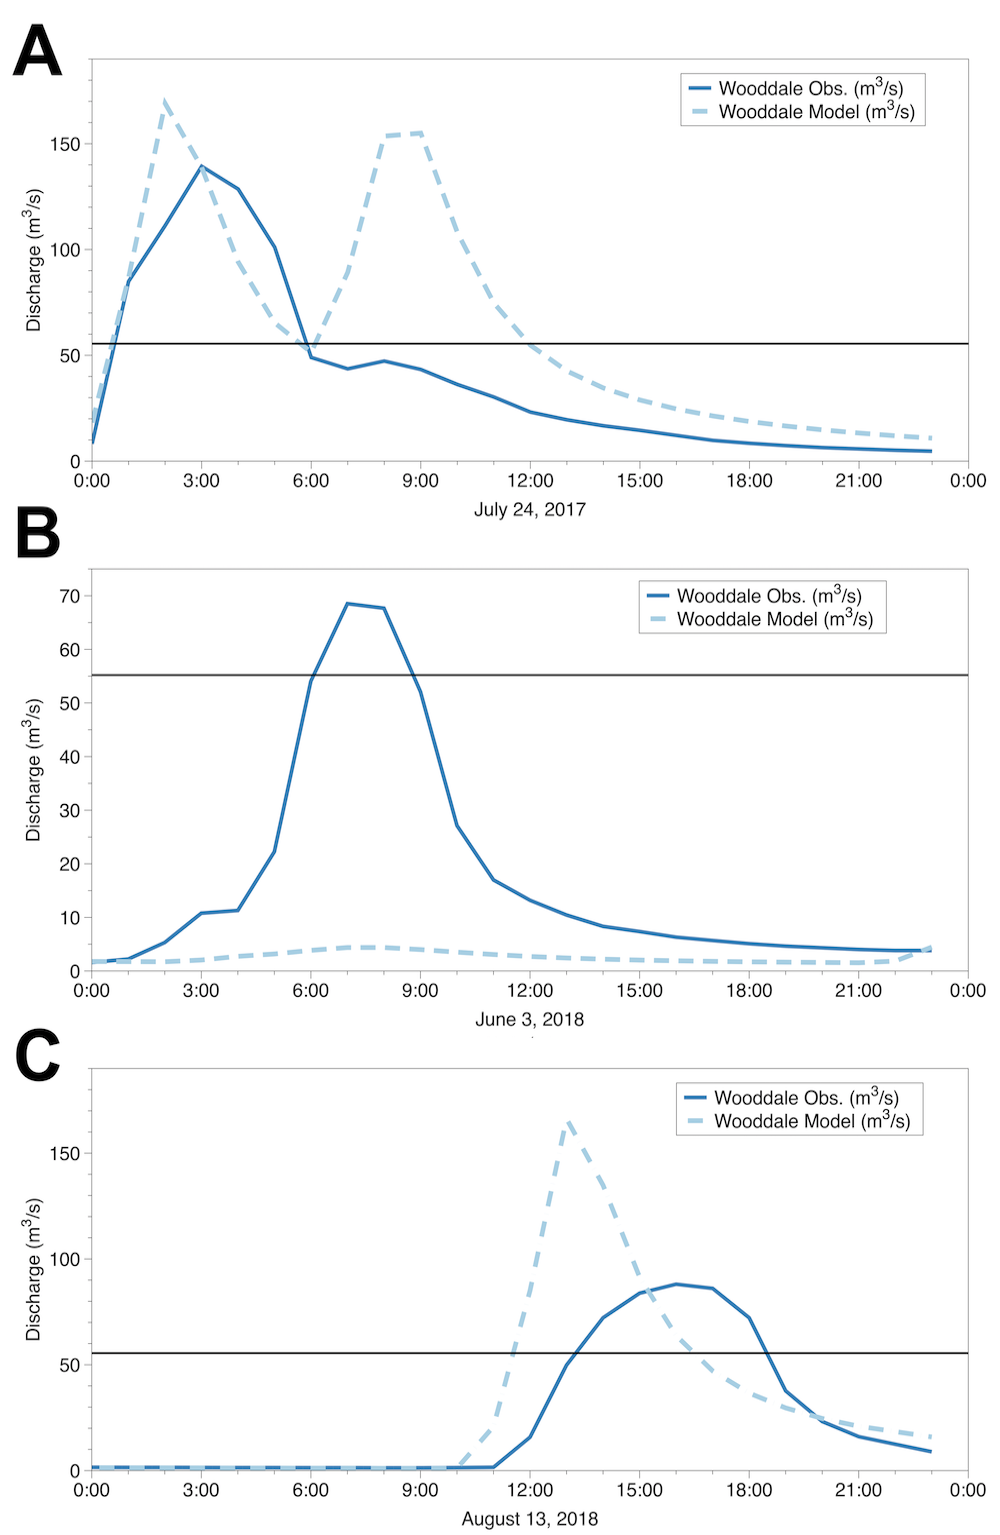
Figure below/right shows the observed and NWM discharge for each of the three convective flooding events at the observation station in Wooddale, PA. Two of the three convective events were associated with overestimation of the discharge by the NWM and one a large underestimation of the flooding event of June 3, 2018, likely associated with a poor precipitation forecast.
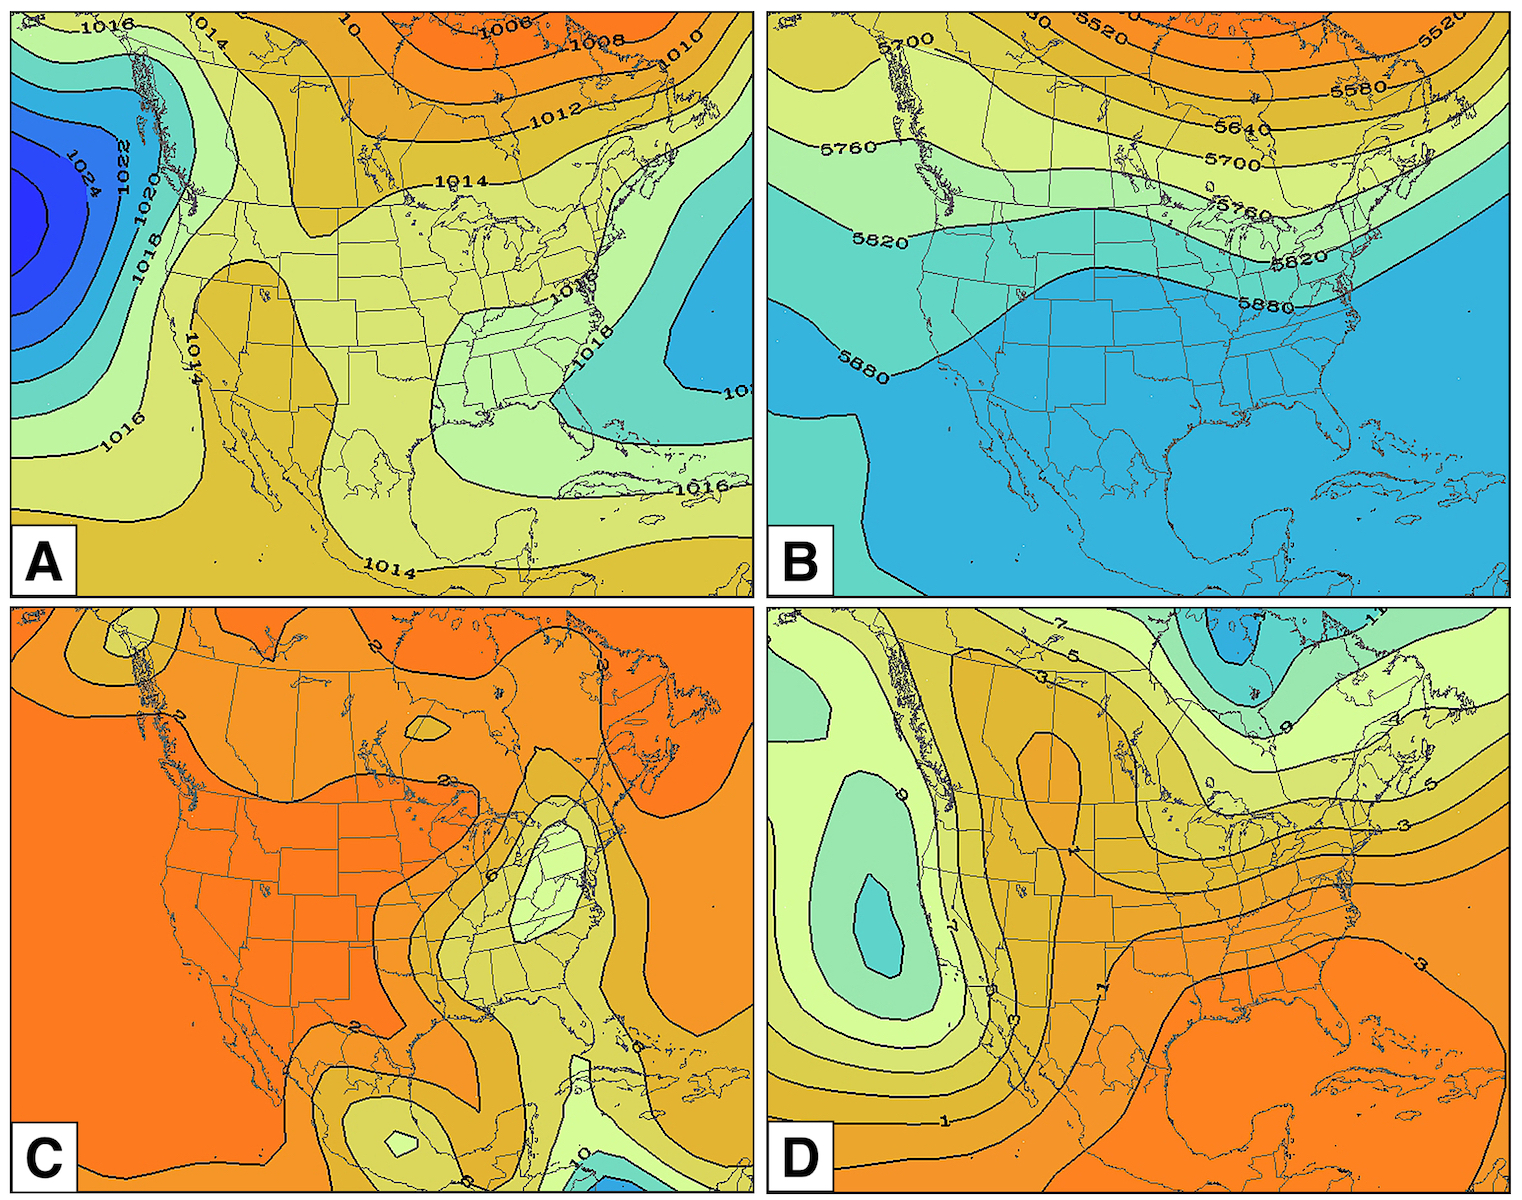
As an example of the synoptic analysis, the four-panel figure below shows the composited sea level pressure, 500 hPa geopotential heights, precipitation rate (mm/day), and lifted index for the eight non-tropical convective events that resulted in large discharge differences between the NWM and observations.
The composited sea level pressure pattern shows a strong area of high pressure over the Atlantic Ocean producing southwesterly winds and the advection of warm, moist air across the region and the composited lifted index of this air is less than zero, indicating at least weak instability. A weak 500 hPa trough to the west of the Red Clay basin provides uplift associated with positive vorticity advection and the resulting composite precipitation rate shows mean values of 8 mm/day (not representative of isolated convective cells across the region).
To sum, the convective events, which all occurred from May through August, are associated with relatively heavy convective rainfall resulting from the advection of moist, unstable air into the region via strong return flow on the western side of high pressure over the Atlantic Ocean. Weak uplift from a 500 hPa trough to the west resulting in heavy convective rainfall.
A few other takeaways: Convective rainfall events were associated with 66% of the 15 largest differences between NWM discharge estimates and USGS observations. Mid-latitude cyclone stratiform precipitation events accounted for the other 34% We also found that 13 of the largest 15 differences between the NWM and observations occurred with pre-cursor soil moisture that was below the mean (dry soil conditions), in conjunction with heavy rainfall.
It is important that water resource managers, emergency managers and other decision makers are aware of the tendencies of the NWM as its use becomes more widespread, but there is still ample work to be done.

Not all agricultural producers have access (or the training) to implement/ interpret high-tech decision-support tools to make irrigation decisions. Atmometers, or ET gages, are a low-cost alternative for informed irrigation.
Reference evapotranspiration data from atmometers at three locations on the Delmarva Peninsula (USA) were compared to Penman-Monteith reference evapotranspiration (ETo) data across two growing seasons to assess their performance. Atmometer reference evapotranspiration (ETa) was found to underestimate ETo by 22.8% in 2016 and 30.4% in 2017.
A Temporal Synoptic Index (TSI) was implemented to determine synoptic-scale climatic controls on evapotranspiration. The TSI uses meteorological observations from a single meteorological station (using four times daily meteorological observations of temperature, dew point temperature, sea level pressure, u and v wind components, and cloud cover) to infer the synoptic-scale atmospheric pattern over a large region, in this case, the Mid-Atlantic region of the United States.
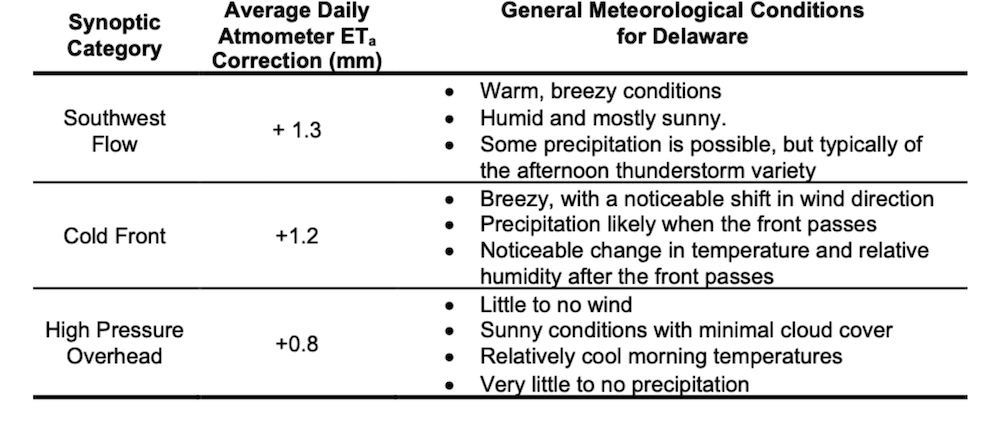
Three dominant synoptic atmospheric categories were defined during the study period: High Pressure (HP), Southwest Flow (SW), and Cold Fronts (CF). Overall, the similarity between ETa and ETo was greatest on HP days, followed by CF and SW days.
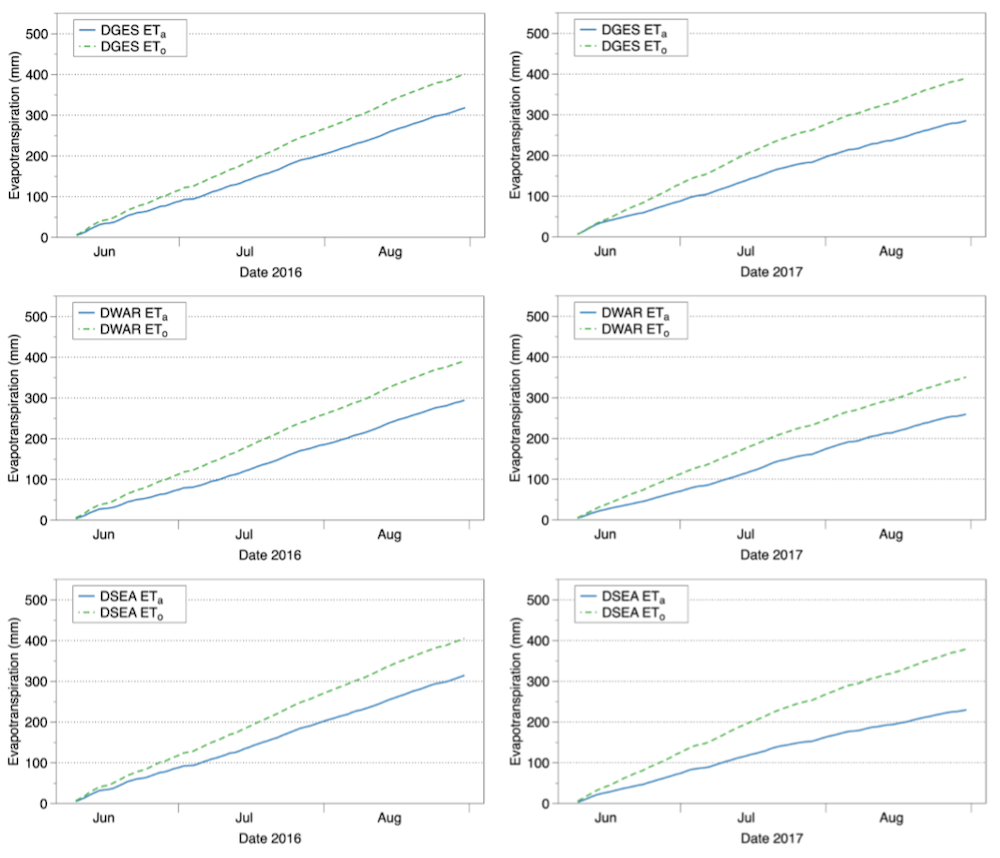
We determined that atmometer performance was most impacted by wind speed, which had the greatest influence on ETa-ETo differences under all synoptic weather patterns.
The 2016 growing season consisted of more days with synoptic conditions that are associated with smaller ETa -ETo differences than the 2017 growing season. Thus, changes in synoptic category frequency impact the nature of the ETa-ETo relationship from season to season.
The result was correction factors with synoptic weather patterns and descriptions to improve the utility of atmometers and remove the need for expensive meteorological equipment to correct atmometer data for those without access.
By understanding the synoptic weather and general meteorological conditions that can lead to differences in ETa and ETo, atmometer users can better account for the day-to-day variability in the atmometer data, thus reducing the potential for crop damage or loss due to miscalculations of irrigation requirements for farm fields.
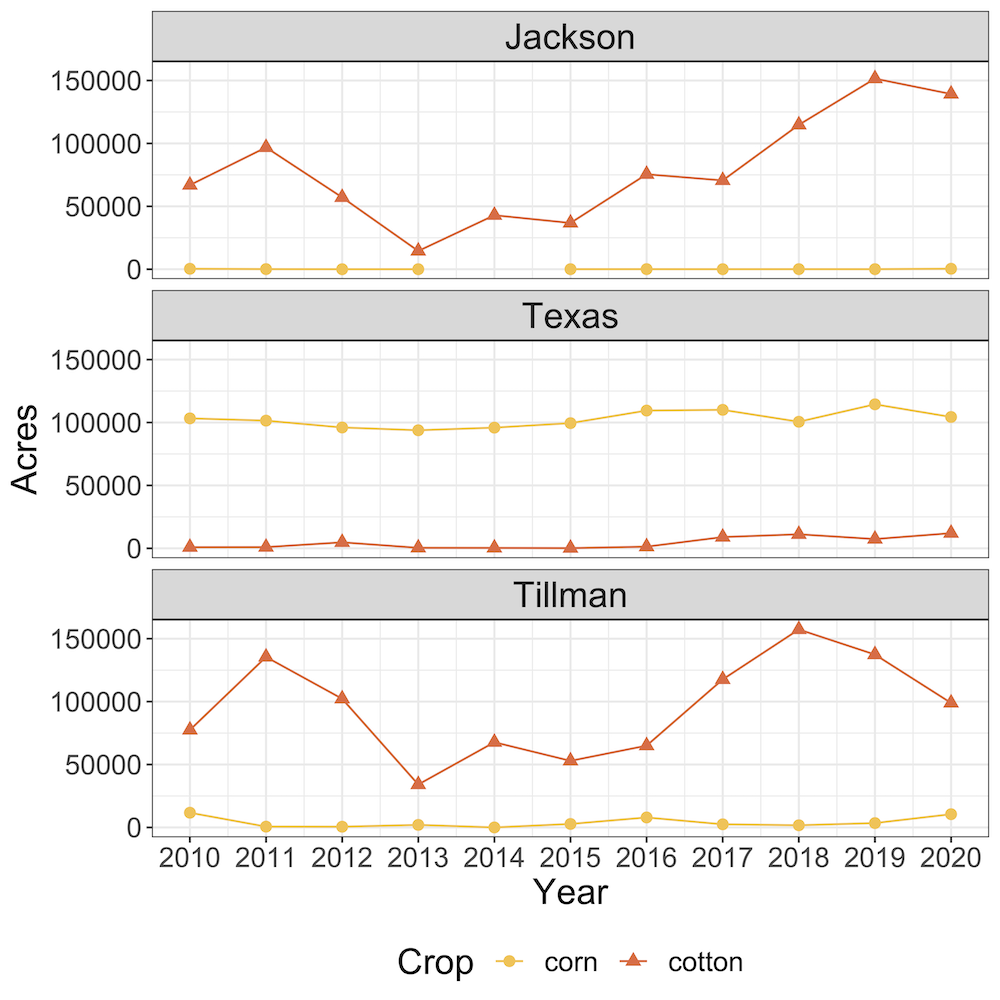
Evolving work centers on Oklahoma agriculture and hydroclimate. Agriculture consumes more than 34,400,000 of its total 44,080,000 acres, ranking it 4th in the nation for agricultural activities.
Oklahoma also gets drier as you move from East to West and relies on diverse water sources to meet its needs. Many Oklahoma crops depend on irrigation, especially corn and cotton, which have increased in the total number of irrigated acres since 2013.
Both crops are planted in the spring, grown in the summer, and harvested in the fall, making them susceptible to increasing summer temperatures and drought.
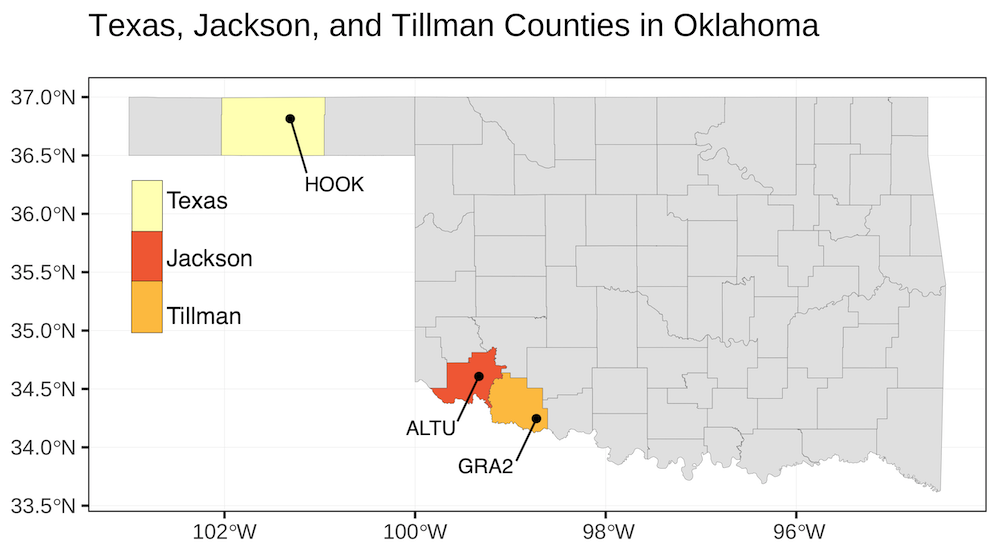
To explore these relationships, three counties are being analyzed from 2010 - 2020: Jackson County (the highest producer of cotton), Texas County (the highest producer of corn), and Tillman County (a high producer of both cotton and corn).
Some preliminary findings: Tillman County cotton production decreased by 75% from 2011-2013 coinciding with exceptionally dry Springs and a spike in irrigation.
Spring and Summer of 2011-2012 had exceptionally high temperatures as well. Crop cover largely decreased the following years (2012 and 2013) as the demand for irrigation increased. Riddled by dry conditions coupled with extremely high temperatures, the study period of 2010 – 2020 covers a tumultuous period for Oklahoma agriculture.
